


The Ichimoku report is back by popular request. This article will outline current trade setups regarding Ichimoku rules.
If you’re new to the Ichimoku Indicator, it is a one-stop indicator. Ichimoku is famous for the clouds that appear on the chart.
The clouds are the distinguishing factor of this indicator. Many traders who use Ichimoku successfully feel the clouds alone allow them to see the potential future moves with greater clarity. There are other aspects that you will be introduced to that will give you further insight on support, resistance and entry levels.

Here is a breakdown of the five Ichimoku calculations for those who need to know and their function:
Tenkan-Sen / Trigger Line (Tan line)
(HighestHigh +LowestLow)/2, for the past 9 periods. Tenkan is the faster moving average and will be used by us as a trigger line when it crosses above or below the Kijun Sen.
Kijun-Sen / Base Line (Light Blue line)
(HighestHigh +LowestLow)/2, for the past 26 periods. Kijun is the slower moving average and will be the base line
Future Senkou A / Leading Span A (Orange line)
The average of the Tenkan Sen or 9 period moving average and the Kijun Sen or the 26 period moving average. The distinctiveness of this is that it is plotted 26 days ahead of the last complete trading day.
Future Senkou B / Leading Span B (Blue line)
The highest and lowest price of the last 52 day added together and then divided by two. This is also plotted 26 days ahead of the last complete trading day. This is similar to a 50% retracement line over the last two months.
Similar names, very distinct functions.
The space in between the Senkou Span A & Senkou Span B is always colored and pushed 26 periods in front of current price. The color of the cloud will depend if the Senkou Span A or Senkou Span B is on top. When the cloud is orange, it is showing you that the Senkou Span B is on top which means that price is under the 52 period price average. This is a bearish sign and you should look to sell when signals are generated. When the cloud is blue, it is showing you that the Senkou Span A is on top which means that price is above the 52 period averages. This is a bullish sign and you should look to buy when signals are generated.
Chikou Span (Green line)
Today’s closing price plotted 26 periods behind. If this line is above price from 26 periods ago, we are in a well-defined uptrend.

When looking to enter into a trade, here are the entry rules I look to buy the pair. The opposite will apply for short trades:
-Price is above the Kumo Cloud
-The trigger line (Tenkan Sen) is above the base line (Kijun Sen) or has crossed above
-Chikou line is above price action from 26 periods ago
-Kumo ahead of price is bullish and rising
-Entry price is not more than 150 pips away from the Tenkan Sen / trigger line as it will likely whip back to the line if we enter on an extended move.
If you would like assistance with the right trade size for your account when a signal is generated, you can find an easy formula here.
Buy USD/JPY
It is often believed that Ichimoku is best used on the Asian currencies like the JPY. Also, the Bank of Japan took a drastic step last week in weakening their currency in a manner never before displayed. JPY has been on a constant fight to weaken their currency without the success they hoped for but last week they had the Minister of Finance & Minister of State for Economic and Fiscal Policy all state their commitment to weaken the currency to support their export based economy . Because the Bank of Japan wants to weaken the Yen to boost their export based economy and the USD is seen as the safest currency as the Eurozone sorts out its fiscal mess we have underlying conditions supporting this Ichimoku signal.
Created by Tyler Yell, CMT
Technically speaking, the JPY is one of the weakest currencies on the daily chart in aggregate against the 100 day moving average.
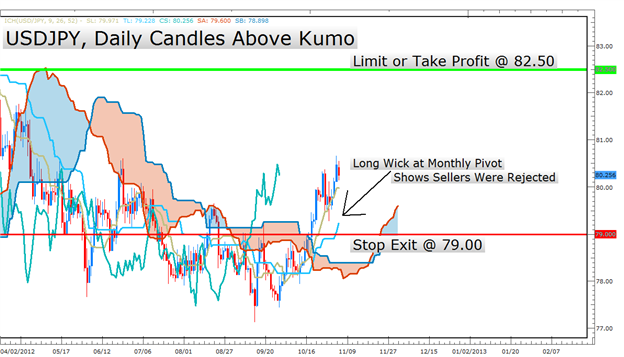
This pair also meets the Bullish Ichimoku rules because price is above the cloud and corrections have stayed above the cloud. What I like most is how there was a push off the monthly pivot on 10/18/12 to the upside. With the signal or Tenkan Sen above the base line or Kijun Sen the bullish sentiment remains.
Lastly, the kumo cloud is bullish and as a leading indicator is pointing upward with the Senkou A above the Senkou B.
Buy USDJPY @ Market
Stop @ 79.00
Limit @ 82.50
BUY CHF/JPY
As QE Infiniti came across the wires in September the CHF has been a shining star. When we put the consistent strength of the Swiss Franc (CHF) against the weakening JPY as mentioned earlier a clear trend is displayed with Ichimoku that highlights a potential trading signal.

Technically speaking, a trend line that has been honored many times since mid-summer signaled this trade along with other Ichimoku rules all checking off. Expect the bulls to fight back as price approaches the rising trend.
The kumo cloud guides us upward guidance and the Kijun Sen (blue base line) acted as a strong form of support last week when the CHFJPY tested 0.8450 and then bounced nicely.
The Tenkan Sen and Kijun Sen both point to buying which allow us to approach CHFJPY with a buy at market with a stop at the top of the cloud and a limit in line with the trend line with a good 1: 2 risk: reward ratio.
This is one of my favorite trades given the strength of the CHF and the potential JPY weakness in months ahead.
Trade size is key when going after a big move like this despite the probability.
Buy CHFJPY @ Market
Stop @ 0.8350
Limit @ 0.8800
Exotic Trade: SHORT USDSGD
Recently, you were introduced into the exciting world of exotic Forex pairs and how to trade them with a steady hand. You will often find some of the better technical set ups in exotic pairs so they naturally belong in the article that gives you purely technical trading signals.

Created by Tyler Yell, CMT
Price has consistently remained below the cloud since mid-2012. All Ichimoku rules are met and clear us for a sell trade.
Short Entry USDSGD @ 1.2200 or less
Stop @ 1.2400
Limit @ 1.200
Going forward you will be updated on how these trades are doing. Naturally, these are longer term trades as we look at the Daily Chart and are seeking to follow the defined trend. We will do two reports a month and you may find that few or none of the trades have closed out yet as price makes it way to either the profit target or the stop exit.
---Written by Tyler Yell, Trading Instructor
To contact Tyler, email tyell@dailyfx.com .


