


By: Jeremy Wagner, Lead Trading Instructor
A look into the market volatility reveals forex movements are about half as volatile as the stock market. Therefore, choose to trade a pair that meets your volatility appetite.
The crash in stock prices we have seen in the past 2 weeks has created a significant increase in volatility. For the past 3 trading days, the stock market movement has seen little net progress though the daily trading ranges have hovered near 5%.
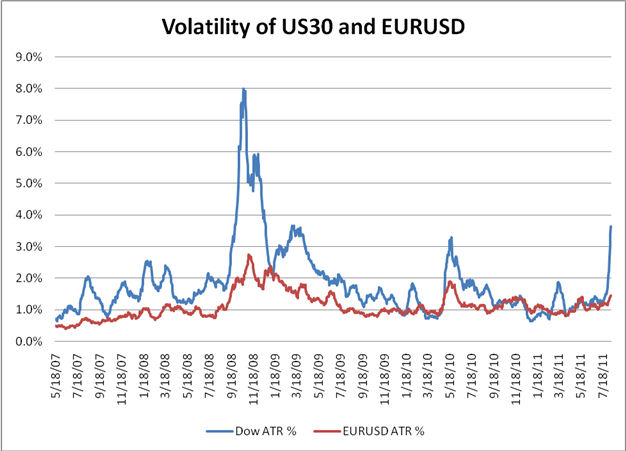
The chart above shows how the Average True Range (ATR) has tracked as a percentage of the price. So yesterday, the ATR value for the EURUSD was 205 pips and the closing price was 1.4239. Therefore, the calculation is :
.0205 / 1.4239 = 1.4% Average Daily Range
This means the average daily range is running about 1.4% of the price. When the percentage increases, that means volatility is increasing. The chart above covers the past 4 years of data so we can see how these percentages move during quiet and volatile market conditions.
The picture is fairly clear. The stock market has typically been a more volatile market to trade relative to the EURUSD. And lately, that volatility has picked up in stocks with less of an uptick on the EURUSD.
Since August 1, 2011, the EURUSD Average Daily Range Percentages have been running about 1.1% to 1.4%. During the same time period, the US30 (a CFD that tracks the Dow Jones Industrials) has grown from 1.6% to 3.6%. So the stock market is running about twice as volatile as the EURUSD.
In my webinars this week, I asked the listeners about how much volatility they like to trade. Depending upon your volatility appetite will depend on which pair you should consider trading.
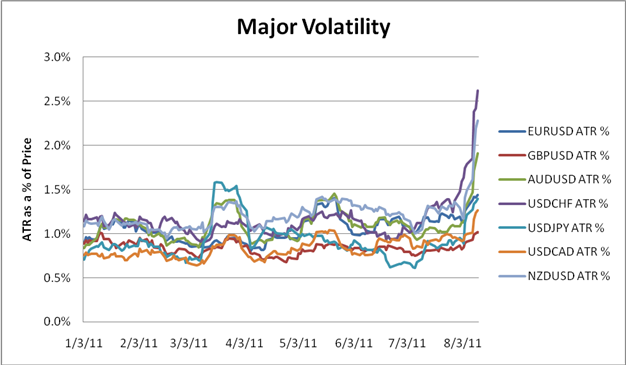
The above chart lists the ATR percentages for the 7 majors. The USDCHF, NZDUSD, and AUDUSD show the most volatile pairs involving the US Dollar. The least volatile majors are the EURUSD, USDJPY, USDCAD, and GBPUSD. If you find yourself thirsty for volatile pairs, consider the CHF, NZD, AUD and their crosses with each other.
If you want less of a roller coaster ride in the market, lean towards the EUR, JPY, CAD, GBP and their crosses with each other.
Also, volatility in your trading account also depends on the amount of effective leverage utilized. Relatively less effective leverage will smooth out the peaks and valleys of the equity in your account. If you find the market upsetting your stomach, check the pair you are trading AND the leverage you are using.
Additional Education Resources
Measuring Volatility with Average True Range (ATR)
Money Management Lesson 1 Video
How to Trade a Breakout on the EURUSD
Jeremy Wagner contributes to the Instructor Trading Tips articles.
http://www.dailyfx.com/how_to_trade_forex/course_trading_tips
To receive more timely notifications on his reports, email jwagner@dailyfx.com to be added to his distribution list.


