


While I occasionally trade from the Daily chart, primarily I use it to determine the trend of the pair.
Once I have identified the pair that I feel has the strongest trend based on the Daily chart, I will usually enter on a 4 hour or 1 hour chart...whichever time frame best optimizes my entry.Here's what I am looking for chart by chart...
The Daily Chart:
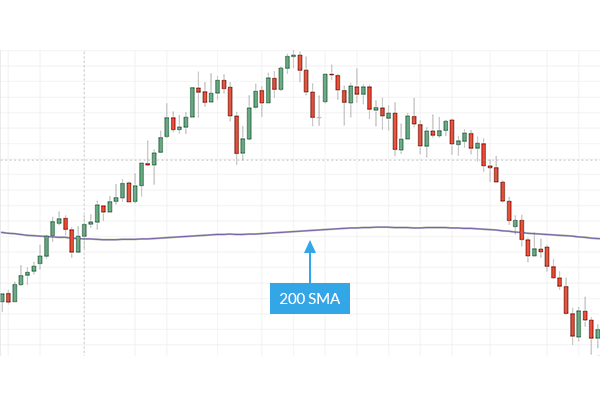
The Daily Trend on the NZDJPY is down. This determination is made based on the pair making lower highs and lower lows, price action is below the 200 SMA and pulling away from it and, at the time of the analysis, the NZD was the weakest currency and the JPY was the strongest. Also, looking at Slow Stochastics, I see that it is below 20 which is a very bearish sign.
Given all of the above, I know I will only be looking for opportunities to sell the pair as they will have the greater likelihood of success. (Trading in the direction of the longer term trend offers us that edge.)
The 4 Hour Chart:
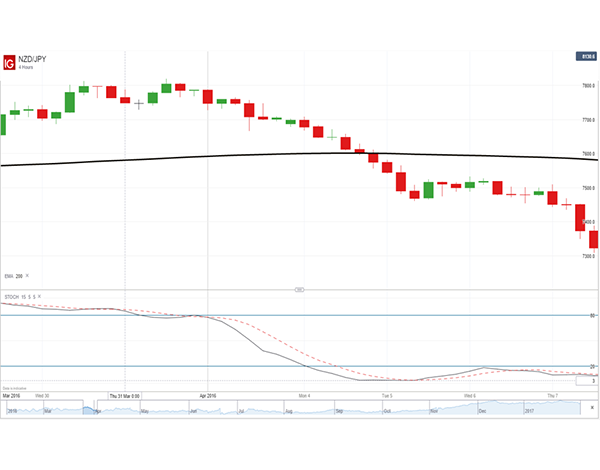
Then I will look to the 4 hour chart and look for a retracement (a move against the Daily trend) to be finishing and beginning a new move to the downside. In other words, a fresh move back in the direction of the Daily trend. Sometimes that fresh move will present itself straightaway or I may have to wait for the set up to occur.
In the case of this particular 4 hour chart I would need to wait for the pair to cycle back up as a new move to the downside has already taken place over the last five red candles on the far right of the chart.
I will also run through this same process on the one hour chart looking for the same set up.Once a“fresh move” begins on either the 4 hour or the 1 hour chart, an entry can be made with a stop placed above the highest level of the recent retracement. (Stochastics, MACD or RSI can be used to further time the entry.)
The 1 Hour Chart:
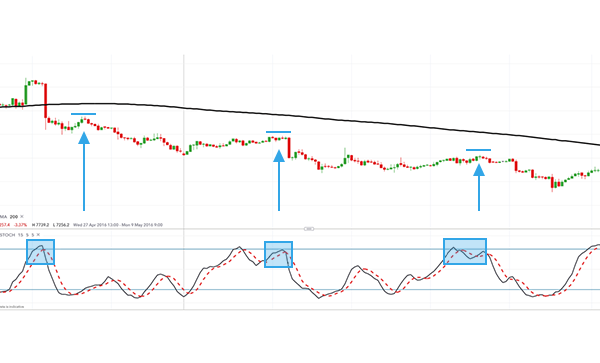
In the case of this 1 hour chart, I would be waiting for a pullback/retracement to take place to short the pair.
Since the pair has been in a strong, on-going downtrend on the Daily chart, I would have been able to successfully sell the pair at any of the points on the chart after the retracement (black arrows) takes place. The short position would be opened when momentum shifts back to the downside (Stochastics crossover within the black circles). In each instance the stop would go above the most recent high approximately at the black lines.Sidebar: Some traders will become frustrated when they see price is moving opposite the direction of the Daily trend. Don’t worry about it. It is fine since that means a retracement is taking place and once that is complete, we will be looking at an opportunity to enter the trade in our direction of choice...the direction of the Daily trend.
Next: Manual Back-Testing: Practicing the Art of Trading (3 of 50)
Previous: The Trader's Plan


