


Our live webinar on Stochastics yesterday prompted several questions regarding the indicator. Below are some of the basics surrounding its use.
Stochastics gives its strongest sell signal when the two moving averages that comprise it have first been above 80 and then close below the 80 level. The strongest buying signal is given when the two moving averages have first been below 20 and then close above 20.
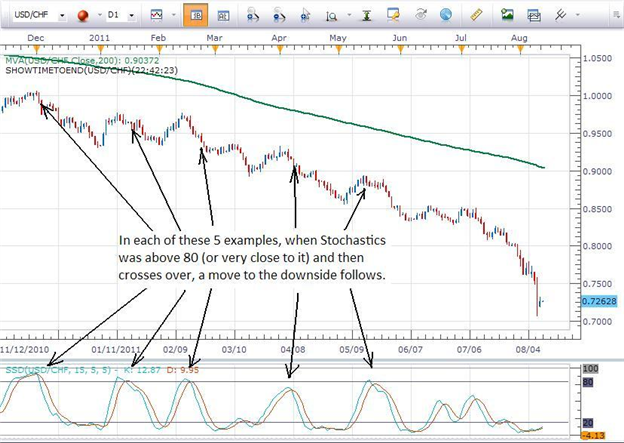
Ideally, we should use Stochastics, and any other indicator for that matter, only to take trades in the direction of the Daliy trend. So if a trader determines that a pair is in an uptrend, they would then consult Stochastics to time their entry after Stochastics has been below 20 and then closed above the 20 level. In a downtrend, such as we have on the Daily chart of the USDCHF below, they would look for Stochastics to have been above 80 and then close below it for the signal to sell the pair.
See the chart below for an example of this...
For Stochastics to close below 80 in a downtrend or above 20 in an uptrend is a much stronger signal than if Stochastics simply goes above or below those levels during the course of the time that the candle is open.
For example, let's say that a trader is using a 1 hour chart. When that 1 hour candle closes at the end of the hour, the trader can check Stochastics to see if the two moving averages were above 20 or below 80 after the close occurred. That will confirm that the indicator did indeed close above or below the requisite level.
If you have a live account and would like to learn a bit more about Stochastics, you can click on the link below…
https://plus.dailyfx.com/tnews/videocourse.do?videocourse=&ib=dailyfx&cmp=SFS-70160000000L8OEAA0
(If you are prompted for a username and password, use the username and password that you use to log into your live trading account.)
Once there, scroll down through the Course Subjects until you arrive at the topic of Stochastics. Click on it and you will open four lessons on the detailed use of the indicator.


