


As with virtually any trading scenario, we must first determine the direction that we need to trade the pair for the greatest likelihood of success.
By looking at the 4 hour chart of the GBPUSD below, there are several reasons we know that we want to go long (buy) the pair. Price action is above the 200 Simple Moving Average and is pulling away from it; the pair has been making higher highs and higher lows (green lines) which indicates an uptrend; and, at the time of this chart, the GBP was the strongest currency and the USD was one of the weaker currencies.
All these point to a buying opportunity. But when do we enter the trade?
Let’s take a look at the trendline…
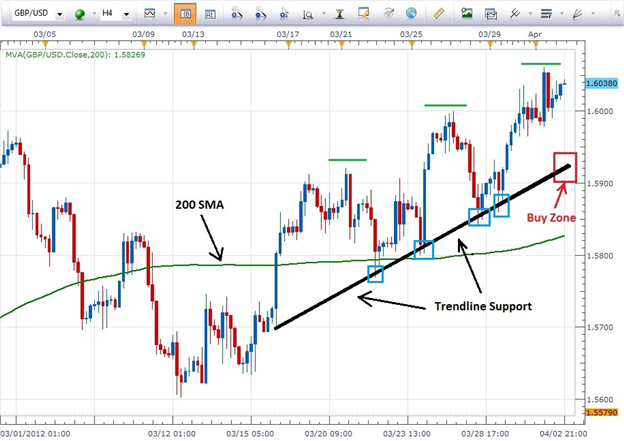
We can see that price action has come in contact with trendline support at several points...note the blue boxes . (Since price has tested and respected the trendline at more than three points we know that our trendline is valid.)
Our entry strategy to buy this pair using trendline support will be to wait for price to trade down to the trendline…into the “Buy Zone”. If price trades into the Buy Zone and stalls and a candle does not close below trendline support, just as in our “blue box examples” , we can take a long position on the pair with our stop just below the trendline or just below the lowest wick that penetrates the trendline.
The trader could exit the trade if price reaches resistance, the previous high, or by employing a simple 1:2 Risk Reward Ratio.
Now let’s take a look at a 4 hour chart of the USDCHF for selling against Trendline Resistance in a downtrend…
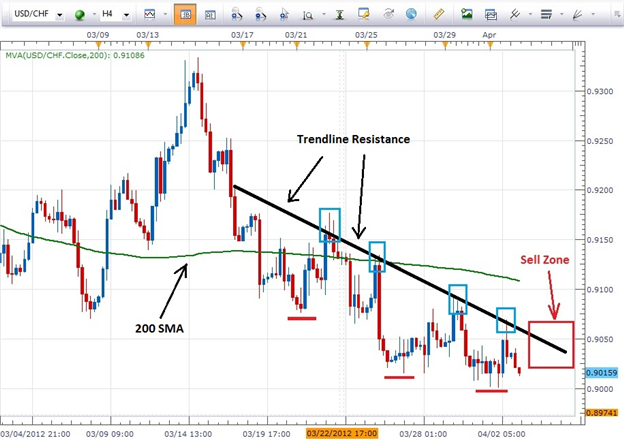
This trading scenario will be virtually the opposite of what we did in the previous buy example.
We want to sell this pair as it has been making lower lows (red lines) and lower highs; price action is below the 200 SMA and pulling away from it; and, at the time of this chart, the USD was weak and the CHF was strong.
Again, price action has tested our resistance line at several points (the blue boxes) so we know the trendline to be valid. In this example we would wait for price to trade up to trendline resistance in the Sell Zone. As long as a candle does not close above the trendline, we would sell the pair with a stop just above the trendline or just above the highest wick to penetrate the trendline.
The trade could be closed should price reach the previous low or we could use a 1:2 Risk Reward Ratio to exit the trade.
Next: Trend Line Support and Resistance (32 of 47)


