


Talking Points:
- USD Crosses trading volume was muted on Recent USD Strength
- Technical View Favor LT USD Strength But Patience Is Needed
- Open Exposure Favors ST USD Weakness Until Resistance Breaks
“Patience is not passive; on the contrary, it is active; it is concentrated strength.”
~Edward G. Bulwer Lytton
FXCM Trading Volume on the Major USD crosses showed a lack of endorsement on the recent move favoring USD strength even when support data was present. A lack of endorsement on new strength shows a countertrend move is in focus. That brings us to technically significant levels of support & resistance to help us identify whether the US dollar is next move is definitively higher or lower. However, with SSI showing retail traders building a relatively aggressive long position on key Majors, sentiment traders are favoring USD downside.
The USD is a mixed bag of sorts. After relatively strong data we have witnessed a failure on the charts to reassert the prior trend that was so prominent from July 2014 through March 2015. Such a lack of trend resumption can easily communicate as much as a continuation move. As noted last week, some of the best trades come when a prior held belief, in this case dollar strength , is invalidated because traders no longer see it as the mindless bid that it was once. If we look across the key components of the US dollar index, we can see a mixed sentiment picture however another component, open interest, may shed light that more USD weakness is in store for the summer.
Click Chart to See Key Levels Identified on USDOLLAR Index
Data that impresses the economists but not the traders delivers a message. The message is that the market has little interest in additional exposure long USD at this point and a decent amount of the current economic data beats may already be price then. The inability for the market to build momentum through the recent fundamental strength favors a potential move lower. A key way to recognize this lack of momentum is to see whether price and volume are in agreement or disagreement around this level. Because volume dropped when the USD showed strength on the charts, we’ll look for a trade set up that favors further USD weakness.
USDOLLAR remains a perplexing chart as it remains still very much up in the air whether we are seeing a primary uptrend resumption or a deeper correction about to unfold. Ultimately it looks like the April/May range needs to be eclipsed in order to clarify what is really going on right now. A look at momentum via RSI shows a decline similar to Fall 2013 where the USD broken into a year long downtrend but it's too early to draw similar conclusions.
A more immediate action level is seen at the 50% retracement of the May-June advance near 11,835 with weakness below there needed to put the index under pressure. On the upside, the 78.6% retracement of the April-May range near 12,050 needs to be breached to alleviate concerns of a possible broader correction developing on the USDollar. To understand the technicals of the USDollar Index components, let's look at what it is made from.
Breaking Down the USDOLLAR Index Components

Having an enlightened read on the US dollar has many benefits. In order to derive an enlightened understanding of what is happening in the US dollar from both a sentiment, volume, and technical view will have to break down the components of the US dollar which is an equal weighting of the Japanese Yen, your own, British pound, and Australian dollar as you can see in this image from FXCM.com.
This article will walk you through the volume, sentiment, and technical overview of each of these components versus the US dollar. While the picture is not crystal clear, we can derive an understanding of what could be a catalyst for the next big dollar move which could help position ourselves into the second half of 2015.
USDOLLAR Long-Term Technical View with Current SSI As Of June 12, 2015

(Created using Marketscope 2.0 charts)
Complementing sentiment and volume is the technical analysis approach. Technical analysis looks for potentially repeatable patterns that can provide an edge, so long as risk is managed. The chart above shows a long-term USDOLLAR chart that has been moving progressively higher since the summer of 2011. This trend is strong but as you can see it has had its share of trend corrections. Combining technical, volume, and sentiment, we may be seeing the start of another such correction that does not necessarily invalidate the larger uptrend that may put long-term buying preferences on hold as long as the pair sits below 12,044/24.
The labels on the chart favor a multi-year head and shoulders. So far, this has hit 61.8% of the intended target near 12,850 and may indeed still hit that level. For the time being, the market seems to be falling out of favor with the USDollar from a sentiment and volume point of view.
If you are unfamiliar with sentiment and volume here is a quick explanation on how this article will look at these circumstances pair moving forward.
Retail Sentiment is acquired using DailyFX Plus’ Speculative Sentiment Index. It is free for real FXCM account holders, but is also free for anyone using a two week trial: DailyFX Plus Trial. Most often, SSI will help you see the beginning of a new trend, which is historically fought by the retail trading crowd.
Retail Volume is available on FXCM’s Trading Station Desktop platform. This free software can be downloaded here and a free demo login can be acquired here. Real Volume is a default indicator that can be added to your charts. Volume is used by Institutional FX traders as well as traders from other markets to understand market participation in a move.
Breaking Down the Components of the USDollar Index via Positioning, Technical View & Volume
EURUSD Shows Aggressive Preference by Retail Crowd to Sell
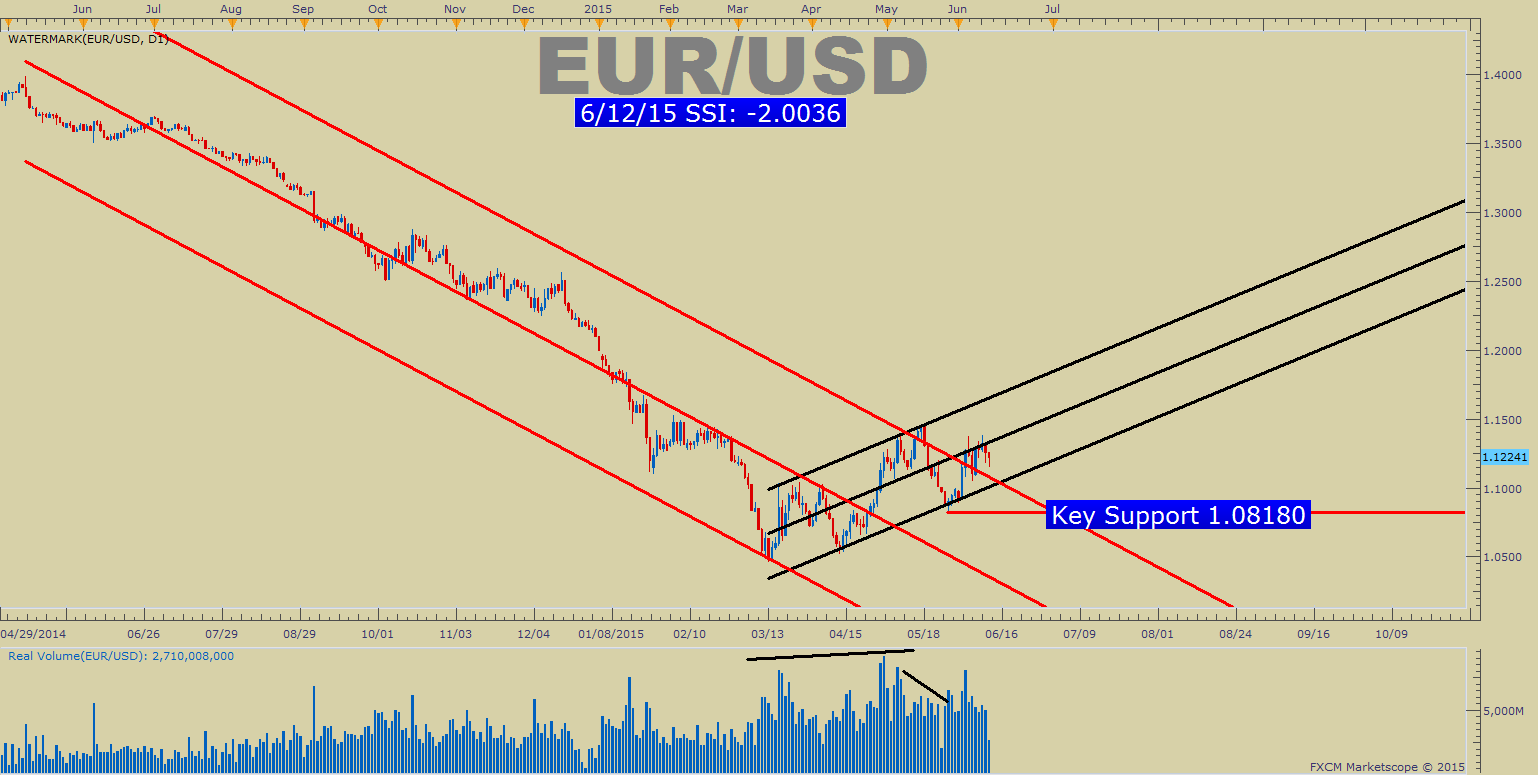
(Created using Marketscope 2.0 charts)
EURUSD continues to favor a bullish bias when comparing technical, volume and sentiment. From an SSI perspective, we’ve seen the ratio of long to short positions at -2.00 as nearly 68% of traders are short. The new channel in black is showing a development of higher lows and lower highs and as long as price moves higher in the channel of current support at 1.0818, a look higher is preferential. Short positions increased by 11% over the last week but that is roughly offset by new short positions over the last week. However, a key point is that recent moves lower happened on little volume showing that traders are not endorsing the move lower. This type of development encourages waiting for support to break to join on a potential larger breakdown if one happens at all and favor further upside until 1.0818 gives way.
USDJPY Is No Longer Attracting the Buyers It Once Did When Breaking To Multi-Year Highs

(Created using Marketscope 2.0 charts)
USDJPY has seen a move to 13 year highs on very low volume. This is a discouraging signs for those looking for the stalwart trend to continue. To be fair, should the USD strengthen, JPY along with AUD appear to be the low hanging fruit but until that scenario plays out, a break of support could cause a vacuum like move to the downside as many rush for the exits at the same time. The week over week positioning doesn’t provide a lot of insight as the changes are neutral. From a technical point of view, the 120.50-118.87 would need to break before a short should be considered due to the strength of the underlying trend. Therefore, like EURUSD, this type of development encourages waiting for support to break to join on a potential larger breakdown if one happens at all.
Cable Saw a Clear Drop in Volume on the Recent Dollar Strength
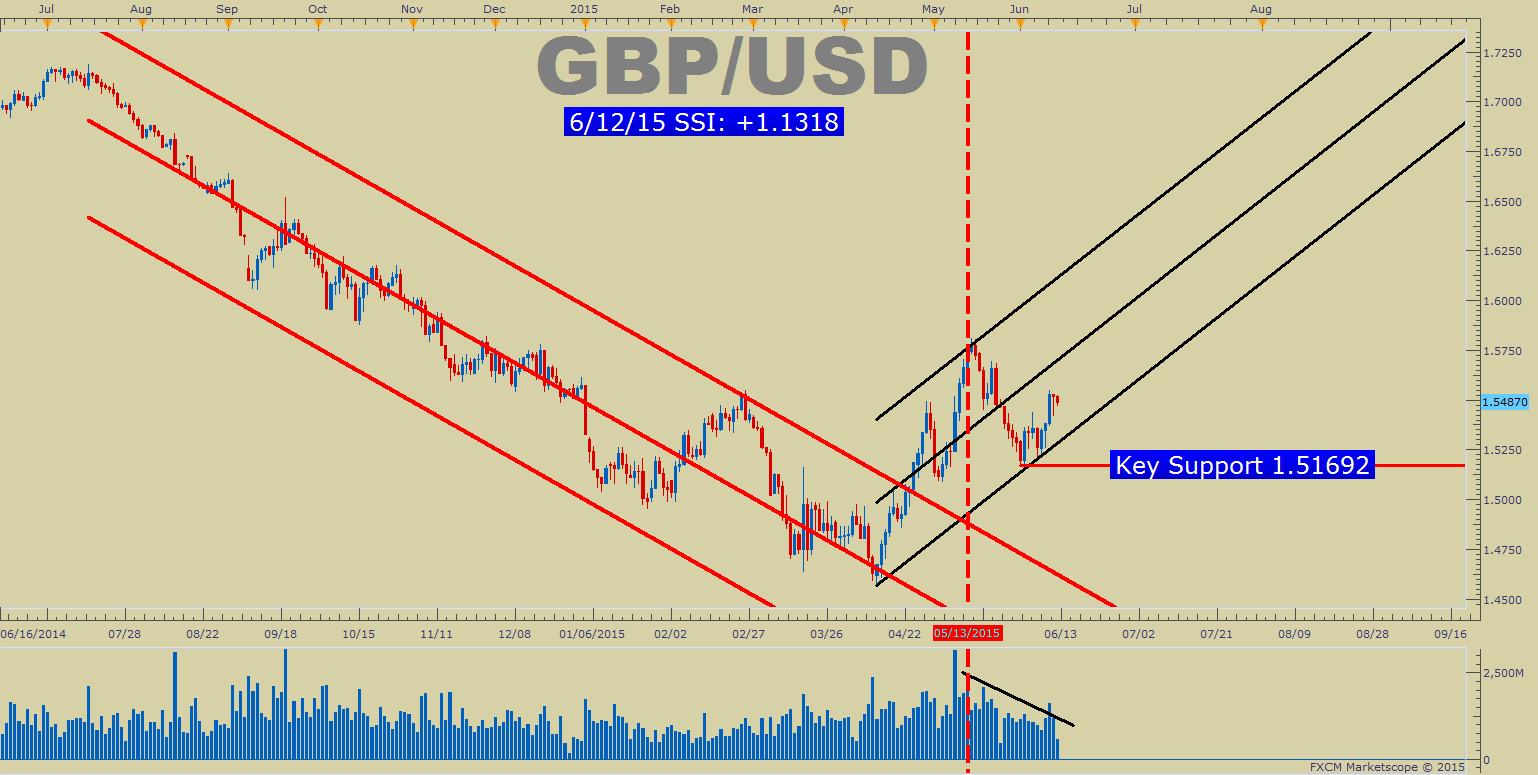
(Created using Marketscope 2.0 charts)
GBPUSD or cable has seen the least exciting SSI ratio where it is nearly flat at +1.13. What is of note is thatshort cable positions are 11.0% higher than yesterday June 11th, 2015 and 28.8% above levels seen last week. As long as price remains above support in the rising channel of 1.5169, you may want to be watchful of a push higher. You’ll notice the recent price channel in black is one of the more aggressive channels out of the prior trend and seems to display the market prefers to play cable as a way to express USD weakness. This type of development encourages further upside as Sterling appears the strongest of the components of the USD index over the month of June.
If USDOLLAR Breaks Higher, AUDUSD Appears To Be the Favorite Sentiment Backed Trade Short
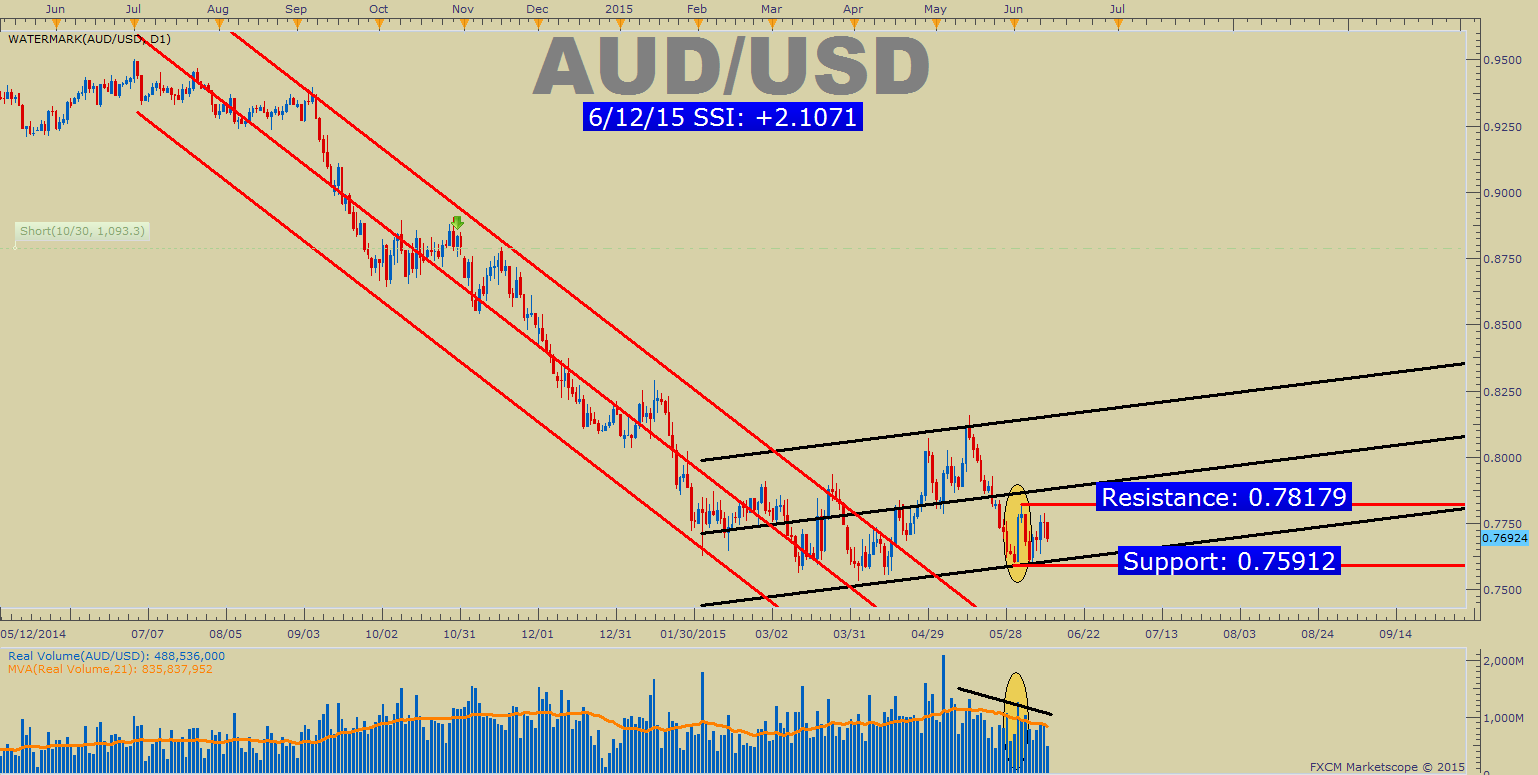
(Created using Marketscope 2.0 charts)
AUDUSD has seen the ratio of long to short positions at 2.10 as nearly 68% of traders are long. Be watchful on the increase in new short positions as AUDUSD saw a very aggressive increase in short positioning. Short positions are roughly 12.5% higher than yesterday, June 11th, and 46.0% above levels seen last week. This type of development encourages waiting for support to break to join on a potential larger breakdown if one happens at all.
In Conclusion
Every pair has its own sets of tendencies and patterns. USDOLLAR Index is a compilation of 4 different pairs equally weighted so it can be helpful to break it down by the sum of its parts. So far, USDOLLAR has not attracted the volume on the recent showing of strength. This displays that traders are not showing a lot of enthusiasm for USD strength that would be needed to carry the index to new multi-year highs. The move lower since the Opening Range high for June at 12,044 has so far developed in three waves so it’s difficult to tell what the follow through will become. Many traders who want to risk this trade may find it best to expect a weak retracement higher that could give you a better risk: reward.
Another way of looking at volume and price action can be seen via David Rodriguez’s great article, US Dollar Fails at Key Support - Next Levels We’re Watching.
Thanks to technical analysis and the Ichimoku Cloud , we have a firm shelf of resistance in the cloud. If price breaks the cloud and the lower high of 12,044 with momentum following through, we can look further to potential new cyclical highs with AUDUSD & USDJPY being the low hanging fruit currently.
In summary, the sentiment and volume readings are providing signals showing the turn lower could have room to run. Please remember that risk must always be managed in case this does not develop as it has historically. Continue to watch price action, sentiment, and volume to see if the view of a turn lower is validated. Also, feel free to utilize a demo account to practice trading risk-free before trading with real money if you are just starting out.
Happy Trading!
Prior Articles:
EURGBP Double Bottom View Backed by FX Sentiment & Volume Analysis
USDCAD Symmetry Backed by FX Sentiment & Volume Analysis
Using FX Sentiment & Volume Analysis to Spot USDJPY Trend Resumption
EURJPY New Trend - FX Sentiment & Volume Analysis
---Written by Tyler Yell, Trading Instructor
To contact Tyler, email tyell@dailyfx.com
To be added to Tyler's e-mail distribution list, please click here
Tyler is available on Twitter @ ForexYell
Video Lessons || Free Forex Training
Trading Using Fibonacci (13:08)
Trading With Moving Averages (14:25)
Reading the RSI, Relative Strength Index (13:57)
Money Management Principles (31:44)
Trade Like a Professional Workshop (1:44:14)


