


Article Summary: Ichimoku is a trend trading system that looks for multiple technical indicators to align before entering in the direction of the trend. One aspect that visually grabs most traders is the width of the cloud. While not a specific indicator, the cloud width can give you a gauge of trend strength so you can decide for yourself if the strength of the current trend is one you wish to ride or not.
While Ichimoku is far from a basic indicator, it can be very helpful to new and experienced traders alike. Ichimoku translates current price action candles so you know if there is a trend at present and if so, is the trend at a price where it makes sense to enter or wait for a better price. While trading on Price Action alone is the preference of many, Ichimoku helps you gauge entries based on support while using the cloud to give you a bias in the direction of the trend.
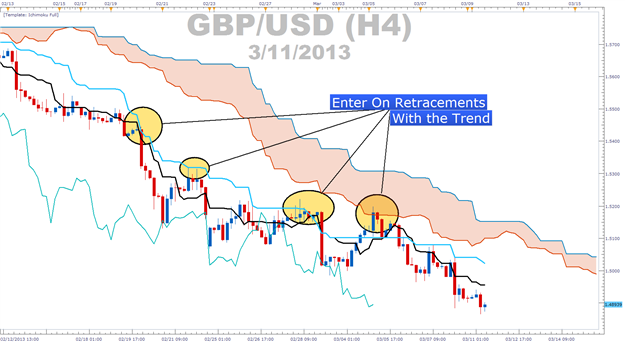
Learn Forex: Ichimoku Cloud Thickness Can Be Helpful for Trend Entries
Breaking Down The Cloud
The Ichimoku cloud takes two very distinct measurements to give you a full picture of the trend at hand. The first line (orange on Marketscope 2.0 Charting) is known as Leading Line A and is the midpoint of the Trigger Line or 9 period mid-price moving average (Black line) and the Base Line or the 26 period mid-price based moving average (Light Blue line). The distinctiveness of this is that it is plotted 26 days ahead of the last complete trading day.
The other line of the cloud (dark blue on Marketscope 2.0 Charting) is known as Leading Line B and is the mid-price of the last 52 trading periods. In other words, the other cloud line takes the sum of the highest and lowest price over the last 52 periods and divides by two. This provides you with something similar to a dynamic 50% retracement over the last 2 months on a daily chart or 52 periods on a smaller chart.
The space in between the Leading Line A & Leading Line B is always colored and pushed 26 periods in front of current price. The color of the cloud will depend if the Leading Line A or Leading Line B is on top.
When the cloud is orange, it is showing you that the Leading Line B is on top which means that price is under the 52 period price average as we currently see on GBPUSD. This is a bearish sign and you should look to sell when signals are generated (highlighted above). When the cloud is blue, it is showing you that the Leading Line A is on top which means that price is above the 52 period averages. This is a bullish sign and you should look to buy when signals are generated like we see on USDJPY below.
Learn Forex: Ichimoku Works in Both Direction of Trending Markets

Why Cloud Thickness Is Helpful?
Learn Forex: Price Action Easily Breaks Thin Clouds

When price action is near a thin cloud, the trend is rather weak and a trend reversal is more likely. This fact is displayed in that over the last 26 periods for Leading Line A & 52 periods for Leading Line B there has not been significant action or progress in the current trend resulting in a thin cloud. If there had been a steady rise in price the cloud would be rising (or falling) and as price velocity picks up, the cloud gets wider as the Leading Line A breaks away from Leading Line B in the direction of the trend.
Trade of the Week: Long EURGBP with Thick Cloud as Support

Ichimoku Trade: Buy EURGBP as all rules below are aligned on the chart
Stop: 0.8575 (below base line and recent swing low)
Limit: 0.9000 (as of current price, sets our limit at 2 times our risk and in the trend’s path)
If this is your first reading of the Ichimoku report, here is a recap of the rules for a buy trade:
-Price is above the Kumo Cloud
-The trigger line (black) is above the base line (light blue) or is crossing above
-Lagging line is above price action from 26 periods ago
-Kumo ahead of price is bullish and rising
-Entry price is not more than 300 pips away from base line as it will likely whip back to the line if we enter on an extended move.
When employing Ichimoku to spot good entries in the direction of a strong trend, bounces off the base line while honoring the other rules can provide great entries which we see with EURGBP. If price remains above the cloud but is currently below base line then you should keep your eye out for price crossing back above the base line on rising strength. This is often a great indication that the trend is back in full swing.
Happy Trading!
---Written by Tyler Yell, Trading Instructor
To be added to Tyler’s e-mail distribution list, please click here.
Take this free 20 minute “Price Action - Candlesticks” course presented by DailyFX Education. In the course, you will learn about the basics of price action and how to use the clues the market is providing to place trades.
Register HERE to start your FOREX learning now!


