


One of the most common mistakes made by traders; not just new traders but all traders, is the fact that they often win such smaller amounts when they are right than the losses they take when they are wrong.
In the Number One Mistake that Forex Traders Make, DailyFX found that risk-to-reward ratios, also often called risk or money management, was often the most common pitfall for traders.
This article will teach traders to use one of the best indicators available, Price Action, to identify potentially advantageous risk-to-reward ratios, in which traders might be able to make far more on their wins when they are right than they lose on their losses when they are wrong.
This will allow those traders to focus on ONLY opportunities in which they feel they can profit more if they are right than they may lose if they are wrong.
Identifying Support and Resistance with Price Swings
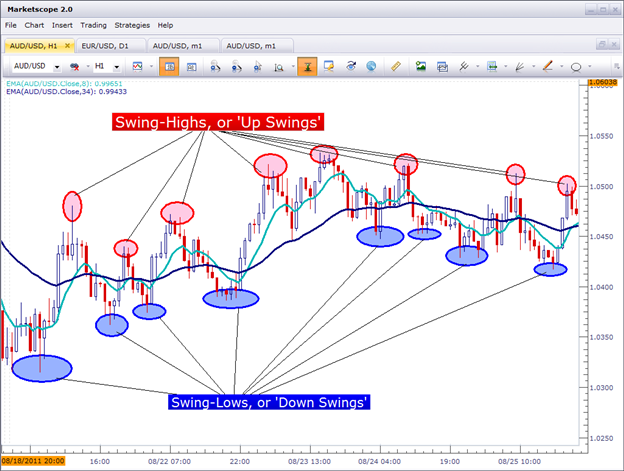
In our Price Action Swings article we looked at ways that traders can look to recent price history to get a rough idea of where Support and Resistance may be most operative. The chart below will show a series of ‘swing-highs’ and ‘swing-lows’ identified:
Created by J. Stanley
To identify a price swing, we simply want to notice the inflection of the candle at that specific period. As you see on the ‘swing-lows’ in the above chart the market had swung down, establishing a low point before moving higher.
The ‘swing-highs’ are the exact opposite. The market oscillated to make an inflection point higher on the chart before reversing and moving down.
We will never be able to predict when a future swing may happen – but we can use the swings that have already taken place to identify potential risk-to-reward ratios.
Identify the Market Condition
The role of price action can differ depending on the prevailing market condition. If the market is moving higher, price will often make a series of ‘higher-highs’ and ‘higher-lows.’ During down-trends, price will often make a series of ‘lower-lows’ and ‘lower-highs.’ The chart below will illustrate both an up, and down-trend:

Created by J. Stanley
However, when the market offers no trend – price action may stay within a ‘range’ of prices; and these also can be used, albeit in a slightly different mannerism. The chart below will show price action swings in a ranging market:

Created by J. Stanley
As you can see in the above chart, almost all of the prices printed on the chart stay within the purple-colored box.
After we’ve identified the market condition, we can then move on to lining up the potential risk-to-reward ratios on the trade.
Matching the Strategy to the Market Condition
Once a trader has analyzed the currency pair’s market condition, they can then begin to setup their trade. An important note here – if the chart you are seeing is showing something unclear – you most certainly do not have to trade it. One of the beautiful parts of the currency market is that there are so many options that you can choose to trade.
If NZDUSD is showing you an unclear chart with a difficult-to-determine market condition, don’t hesitate to flip over to AUDUSD, or GBPUSD, or even EURUSD.
But once the market condition is identified, the trader can begin to outline a potential trade by matching their approach to the market condition.
Just as we looked at in our article ‘Trading Trends by Trailing Stops with Price Swings,’ If the trend is up and the trader is expecting the currency pair to move higher, the goal should be to ‘buy low, and sell high.’ To do this, the trader wants to purchase the pair when price is close to support, or after a recent swing low has been established.
This chart will illustrate how a trader can look to setup a potential risk-to-reward ratio on a trend trade.

Created by J. Stanley
After setting up the trade in this manner, we can then go a step further to calculate the potential risk-to-reward ratio on the trade:
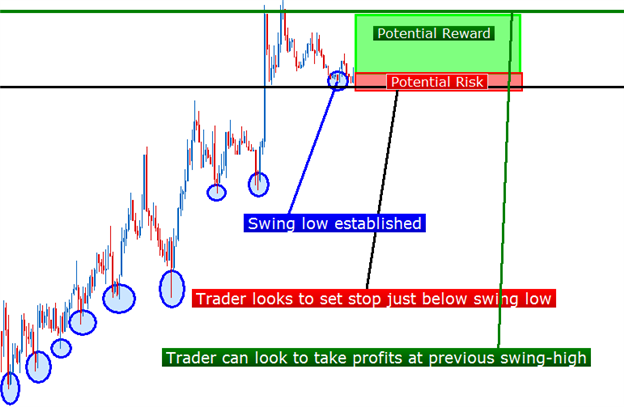
Created by J. Stanley
As you can see, the potential reward in this trade far outstrips the potential risk. As a matter of fact, the potential reward is approximately 5 times that of my potential risk.
So, if I were to get the same setup 10 times and place the same type of trade each time – I would only need to win on 2 of them to put myself in a position for a net profit. 2 out of 10! That is only 20%!
We can do the same type of thing for ranging markets, albeit without the luxury of a strong trend. We would want to adopt the same mantra of ‘buy low – sell high,’ and look to purchase when price is near support or sell when price is near resistance. The chart below will illustrate further:
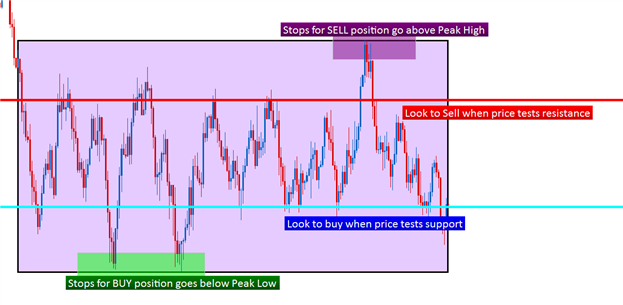
Created by J. Stanley
In ranging markets, traders would want to look to ‘buy low’ when price was at or near support – planning to place a stop just on the outside of support for long positions (and just above resistance for short positions).
Once again, we only want to focus on range trades that offer a one-to-one risk to reward ratio or greater. The chart below will show the minimum accepted threshold before triggering a range trade:
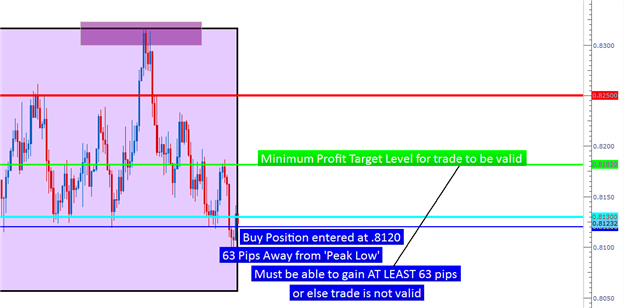
Created by J. Stanley
Next: How to Trade Commodity Channel Index (CCI) in Forex (16 of 50)
Previous: How to Read Risk 'OFF' or Risk 'ON' Sentiment
--- Written by James B. Stanley
You can follow James on Twitter @JStanleyFX.
To join James Stanley’s distribution list, please click here.


