


Article Summary: EURJPY had the most volatility on Monday since the infamous “flash crash” of May 6th, 2010. Now, we have the Italian elections that could wipe out most progress made since the Eurozone’s mid-July announcement of Outright Monetary Transaction’s (OMT) that was meant to revive Italy’s giant bond market. Looking elsewhere, Ichimoku still points out a high probability trade in the direction of the overall trend with less volatile pairs. We’ll also discuss different levels of support for you to look to and use to exit a trade.
Volatility may be great for headlines but it is often a trader’s worst enemy. We recently found that most traders performed best when volatility was lower so the moves could be managed well. Because of that fact, focusing on less volatile pairs will often accommodate a newer trader more favorably than seeking the currencies with the largest Average True Range (ATR).
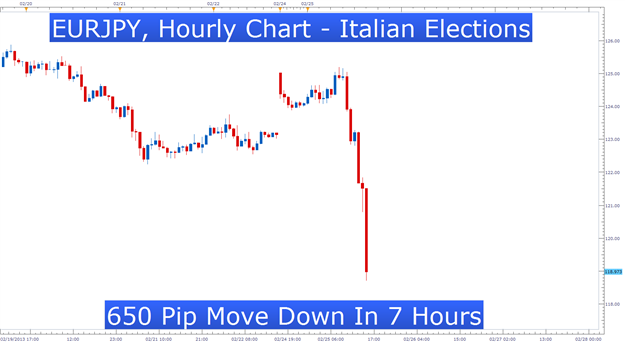
Learn Forex: Volatility Is Hard To Manage Successfully
The Lesson from Today’s Volatility – Identify Risk Upfront
When you enter an airplane, the flight attendant is quick to show you were the exits are located. When entering a trade, your first concern should be managing your risk. The two main ways to manager your risk are through trade size and stop exits on your trade.
Levels of Support & Resistance Identified By the Cloud
When trading with the Ichimoku indicator, the levels or lines of the indicator will also be different exit points of the trade. One of the key rules when trading off the chart is that the signals that get you into the trade should also is the ones to take you out of the trade. Another way to word that is that if your technical strategy would not encourage you to enter a buy trade now, then you shouldn’t be holding on to a low probability trade.
Learn Forex: Levels of Support / Resistance with Ichimoku

Dissecting Support and Resistance Levels to Identify Risk
Ichimoku provides you with 4 levels of support in an uptrend and resistance in a downtrend. Each level communicates something different about the pair you’re trading. Which level you use to get out of a trade is completely up to you and is often determined by your trade size and your percent risk amount which you can determine with the free Risk Management App.
If you’re new to Ichimoku, this will also be an introduction to the lines that make up the indicator numbered 1 through 4. On the chart above, the lines are listed in chronological order. The first line is often considered as a minor level of support with the 2,3, and 4th line are considered major support.
1. Tenkan-Sen or “Trigger Line”
(Highest High + Lowest Low)/2, for the past 9 periods
2. Kijun-Sen or “Base Line”
(Highest High + Lowest Low)/2, for the past 26 periods
3. Senkou Span A or “Leading Line A”
(Tenkan-Sen + Kijun-Sen)/2, plotted 26 periods ahead
4. Senkou Span B or “Leading Line B”
(Highest High + Lowest Low)/2, for the past 52 periods, plotted 26 periods ahead
For lines 3 and 4, you would use the cloud point below the current candle as support and you could adjust the stop exit as the market progresses. The further down you go from the trigger line toward the Leading Line B, the more major the support in an uptrend. Therefore, Leading Line B which is roughly a dynamic 50% retracement point from price over the last 52 days.
Ichimoku Weekly Trade: Sell AUDNZD Off Of Bounce near the Base Line to the Downside
Stop: 1.2500 (near bottom of cloud which is major point of resistance)
Limit: 1.1950 (as of current price, this target is roughly 2 times our risk and is in the trend’s path)

If this is your first reading of the Ichimoku report, here is a recap of the Ichimoku rules for a sell trade:
-Price is below the Kumo Cloud showing a downtrend
-The trigger line (black line on my chart) is below the base line (baby blue line) or has crossed below
- Lagging line is below price action from 26 periods ago
-Future cloud ahead of price is bearish and falling (displayed as an orange cloud)
When utilizing Ichimoku to spot good entries in the direction of the trend,price retracing away from the base line while honoring the other rules can show a strong trend as we see with AUDNZD. The reason for the stop placement is that the clear trend would be nullified if price broke through the cloud showing us that the trend is over. This is why you can set your exit with the cloud and look to ride the trade to a profit target in the trend's path.
Happy Trading!
---Written by Tyler Yell, Trading Instructor
To be added to Tyler’s e-mail distribution list, please click here.
Unsure which indicators match up with your skill set?
Take our Forex Trader IQ Course to receive a custom learning path for how to trade FX.


