


A lot of traders feel they aren’t too different from an animal on the Sahara hunting their pray. Just like the hunting animal knows there are certain environments where they are more likely to score their next meal the trader favors certain set ups before entering a trade. This article will walk you through the environment on the charts that will yield the higher probability candlestick set-ups. You will also be introduced to merging pivot lines that work well with candlestick charting.

Trading by Candlelight
Candlestick charting is a method of displaying price action so that you can readily see the battle and winner of buyers to sellers to obtain distinctive trading signals. Candlestick trading has been around for centuries and has been introduced to the Western world within the last few decades.
There are many individual candlesticks and candlestick patterns that can tip you off to a new move. Common formations are the doji, the shooting star, and the hammer. To get a better handle on different patterns, Daily FX has a course to help you grasp different candles formations to assist your trading.
Combining Market Type with Candlestick Signals
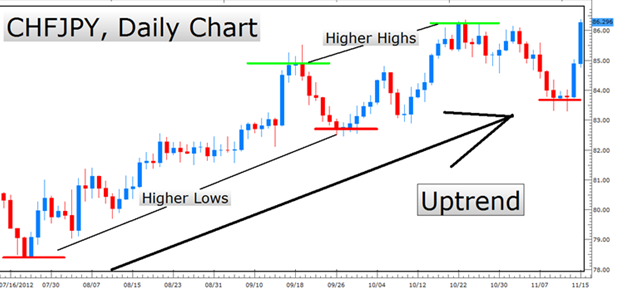
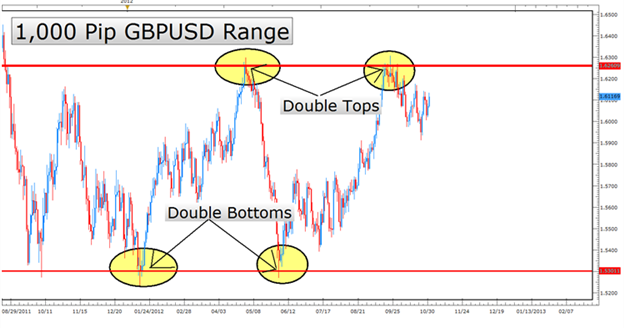
First, it’s important to note that a market is either in one of two common environments. Either a range bound market with price bouncing between support and resistance. This is the most common market environment. The other market that trader’s find themselves in is a trend with price showing higher highs and higher lows in an uptrend or the opposite in a downtrend.
Trending Market:
Ranging Market:
Here is the first rule for candlestick entries that we want to focus on once the market type has been identified.
-When in a range bound environment, we want to focus on candlestick formations or patterns near support or resistance for entries. Support and resistance can be identified by eyeing price action ceiling and floors or by adding Pivot Points to the charts.
-When in a trending environment, we want to focus on candlestick formations or patterns near pull backs in the direction of the trend for entries.
In addition to Pivot Points, we can also look to common indicators like the 200 period moving averages to help us pinpoint candlestick patterns around key prices in the market.
Pivot points are a famous indicator to help you forecast future points of resistance and support to limit risk and find profit targets.
The Pivot number is the high, low, and close added up and then divided by three.
P= (H+L+C)/3= pivot point
This is easier than it sounds because it will be a default indicator you can add.
Once the Pivot Levels are added along with a major moving average, we will look for price action to move to one of these levels. That is when we’ll heighten our attention to patterns that develop to see if a reversal is upcoming or a continuation is shown.
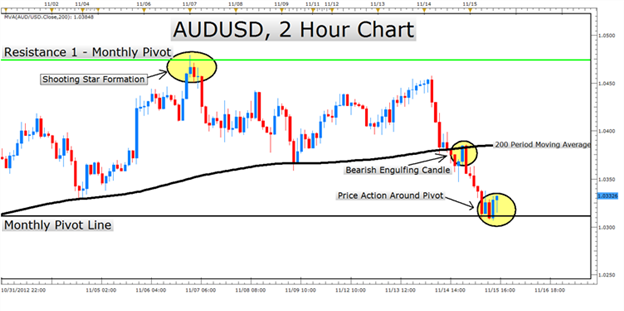
On the AUDUSD, 2 hour chart we see price respect and move off of the monthly pivot price. We also see additional action around the 200 day moving average that confirms the bounce of the Resistance line (green) back down to the monthly pivot line. There is nothing predictive about the Pivot Lines except the fact that many traders look to them in placing profit targets, stop exits or deciding when to stop buying or selling into a move. This gives Pivot Lines a bit of a self-fulfilling power. As you add these lines onto the charts, you see that price often respects these lines in either reversing from them or showing a strong continuation off of them.
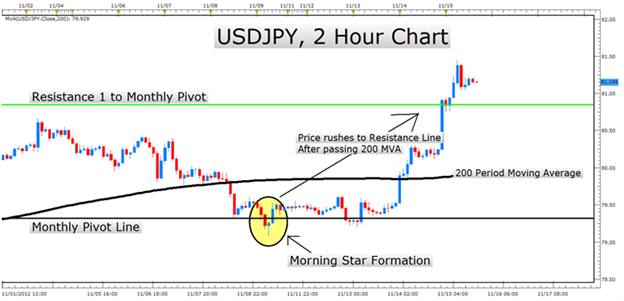
Here is the USDJPY, 2 hour chart which shows price bouncing off the pivot and rushing up to the Resistance 1 line.
The take home message is that you can look to Pivot Points and a large period moving average for reversal or continuation signals and then set your stop below the signal and your profit target near the resistance or support line. This will ensure you keep good risk management while hunting for higher probability entries.
Happy Trading.
Next: Long Wicks Can Provide Valuable Trading Signals (3 of 47)
Previous: Trading Candlesticks
---Written by Tyler Yell, Trading Instructor
To contact Tyler, email tyell@dailyfx.com.
To be added to Tyler’s e-mail distribution list, please click here.


