


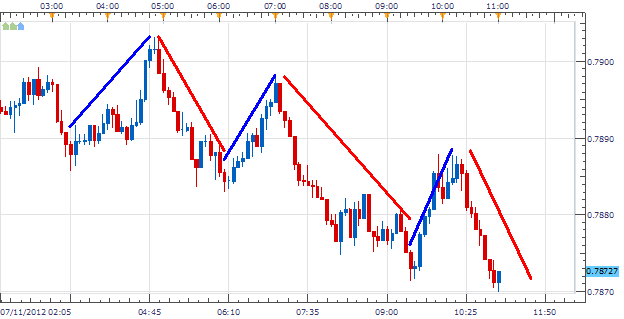
One of the most important skills a scalper is required to learn is gauging short term momentum. Before we even zoom onto a short term graph it is best to answer the following questions. What is my market bias? Will I be looking to buy or sell a particular currency pair?
Take the 5minute EURGBP graph below. Would you be a buyer or a seller here? It is hard to tell with such a limited amount of data at our immediate disposal. To help identify trading opportunities, it is often best to first scale out on a chart and begins by looking at a broader range of price action.
Building Blocks
Prior to scalping on shorter term charts, I recommend a form of multi-timeframe analysis to find market direction. Pictured below we have a 30minute EURGBP graph depicting approximately 1 weeks’ worth of price action. This graph has been segmented into trading blocks by identifying the previous Mondays and Wednesdays. Drawing a Building Block on Market Scope 2.0 is relatively straight forward by using the vertical line function under the insert menu. Just cut and paste the lines on the appropriate dates and you can then begin your analysis.
The purpose of this methodology is to fragment our analysis and ensure that price is heading in a continuous trending direction. If a block is printing lower highs and lower lows, it will be colored red indicating a downtrend. If price is making higher highs and higher lows it should be colored blue indicating an uptrend. A yellow block is reserved for an indecisive market, printing both a higher high and a lower low during one price block. The strongest trends have both Block 1 and Block 2 moving in the same direction. If the trend is unclear and our blocks are colored differently it is time to move on to a new chart for scalping during the current price period.

Block Interpretation
So how should we begin to analyze the blocks placed on the EURGBP graph above? The analysis for Block 1 below begins on Monday July 4th. During this time the EURGBP printed a high of .8055. From the Block 1 high price steadily declined dropping as much as 134 pips to .7921. This block has been colored red indicating that price for this period created a lower low with no new higher high being formed.
The strongest trends have both Building Blocks trending in the same direction. As we can see above Block 2 has also been colored red indicating a continued downtrend. From Monday July 9th through Wednesday July 11th, price printed a lower low at .7894 without creating a higher high. With this analysis completed, we now know that we should only be looking to sell the EURGBP with the scalping strategy of our choice. Traders will look for momentum to carry through Monday, at which point a new block will be formed and our analysis will begin again.
---Written by Walker England, Trading Instructor
To contact Walker, email instructor@dailyfx.com. Follow me on Twitter at @WEnglandFX.
To be added to Walker’s e-mail distribution list, send an email with the subject line “Distribution List” to instructor@dailyfx.com.
DailyFX provides forex news on the economic reports and political events that influence the currency market. Learn currency trading with a free practice account and charts from FXCM.


