


The Gartley trading pattern is a complex harmonic charting setup using Fibonacci Retracements, geared to finding reversals. The gartley is considered harmonic, because it looks for multiple fib retracements from various points on our graph to line up at the same levels. This reversal point is found by measuring the distances between multiple highs and lows between points X through D.
Point X is the primary frame of reference for this pattern, and should be found by pinpointing the highest high in an uptrend. From here, we are looking for our first retracement lower to create point A on the chart. Once X and A are established, we can use a 61.8% Fibonacci to extrapolate point B. Below you will find examples for both bullish and bearish gartley patterns.
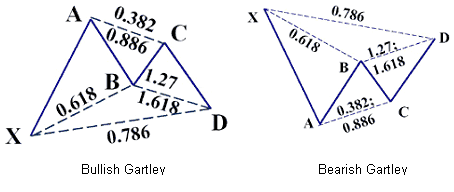
As relayed in the previous Post of the Day, Using the Fibonacci Tool Part II , we want to see if price begins to stall at specific fib levels. In the bearish gartley pattern, traders will look for point D as a point of resistance. Below we can see that point D is found on the AUD/JPY by measuring the 78.6% retracement from XA. The 127 % extension of points BC should confirm this level as well. Once this point is found an entry can be set to take advantage of a bearish reversal. Stops can be set above the created Fibonacci resistance in case price breaks further to the upside.

My preference is to sell the AUD/JPY at the harmonic confluence of Fibonacci retracements near point D (86.30). Stops should be placed above resistance at 87.75. First limit targets should be set target for a minimum 290 pips profit at 83.40 to employ a 1:2 Risk / Reward ratio. Secondary targets can look for a new low under point A at 72.98
Alternative scenarios include prices breaking higher, over resistance.
---Written by Walker England, Trading Instructor
To contact Walker, email instructor@dailyfx.com. Follow me on Twitter at @WEnglandFX.
To be added to Walker’s e-mail distribution list, send an email with the subject line “Distribution List” to instructor@dailyfx.com.
DailyFX provides forex news on the economic reports and political events that influence the currency market. Learn currency trading with a free practice account and charts from FXCM.


