


The BIG Idea on the Australian Dollar Short Trade:
The Australian Dollar is positively correlated (e.g., tends to move in the same direction) as key global assets that appear to be running out of steam and could soon move lower. On the charts, there has been consolidation near multi-year support. A recent pull-back was the May 9 low of 0.7412 where the price was unable to hold above showing underlying weakness.
Point to Establish Short Exposure: Break & close below 0.7300 USD per AUD
Spot: 0.7386 USD per AUD
Target 1: 0.7150 USD per AUD (December 2016 low)
Target 2: 0.6907 USD per AUD (200% Fibo Extension of 2017-2018 Double Top)
Invalidation Level: 0.7530 USD per AUD (61.8% Retracement of June-July Range)
If you are looking for other strong trading ideas, you may enjoy our FREE Trading Guides
The BIG Picture:
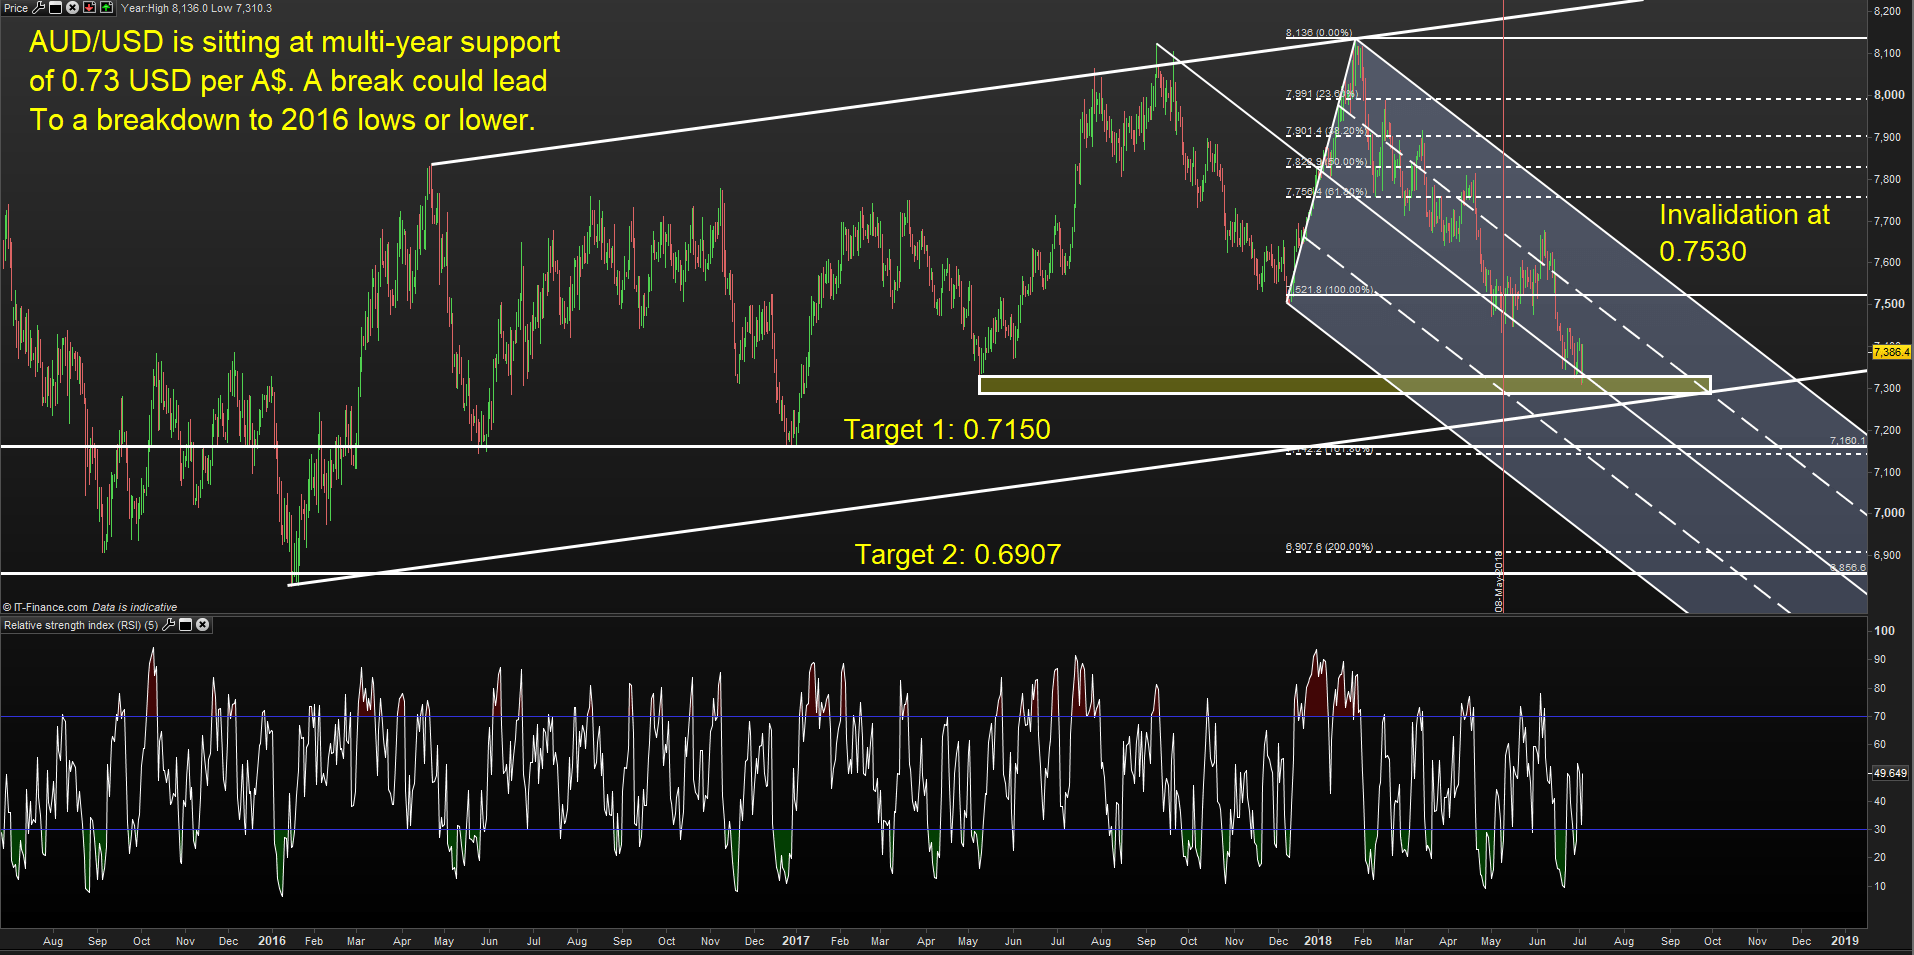
Chart Source: Pro Real Time with IG UK Price Feed. Created by Tyler Yell, CMT
Access our popular free trading guides to enhance your trading strategy here.
Influencing Factors of AUD in US Yields, US Shares May Favor Downside
From a global trade perspective, traders and investors appear to have their eyes on two markets lately: UST 10Yr note yields and the SPX500.
When looking at yields, there remains a concern US yields will continue to flatten when looking at the spread between the 2-year yield and 10-year yield. The spread has recently fallen to 30bps whereas a year ago the spread was 100bps. Additionally, aside from the spike in December and January as USD saw temporary weakness, AUD/USD has fallen alongside the flattening of the yield curve.
US Yield Curve Flattening Aligns With AUD/USD Weakness

Data source: Bloomberg
If the yield curve in the US is going to continue to flatten, which is aligning with a widening premium of US yields over AU yields at the front-end, and the correlation holds up, it seems prudent to favor further AUD weakness.
Looking individually at US 10 year yields, the 3.05% level was briefly touched in Q2 and then quickly moved lower as talks of trade wars saw a run into haven assets like Treasuries. The 3.05% level was also touched in January 2014 that was followed by a greater than 50% retracement to 1.35% in the summer of 2016.
As the trade idea points out, only a break higher in AUD/USD above 0.7530 to 0.7680 that aligns with a widening of the US2US10Yr yield curve would argue that this trade idea is invalidated.
Looking to Equities For Aussie Insight: SPX500 Resistance at 2,800
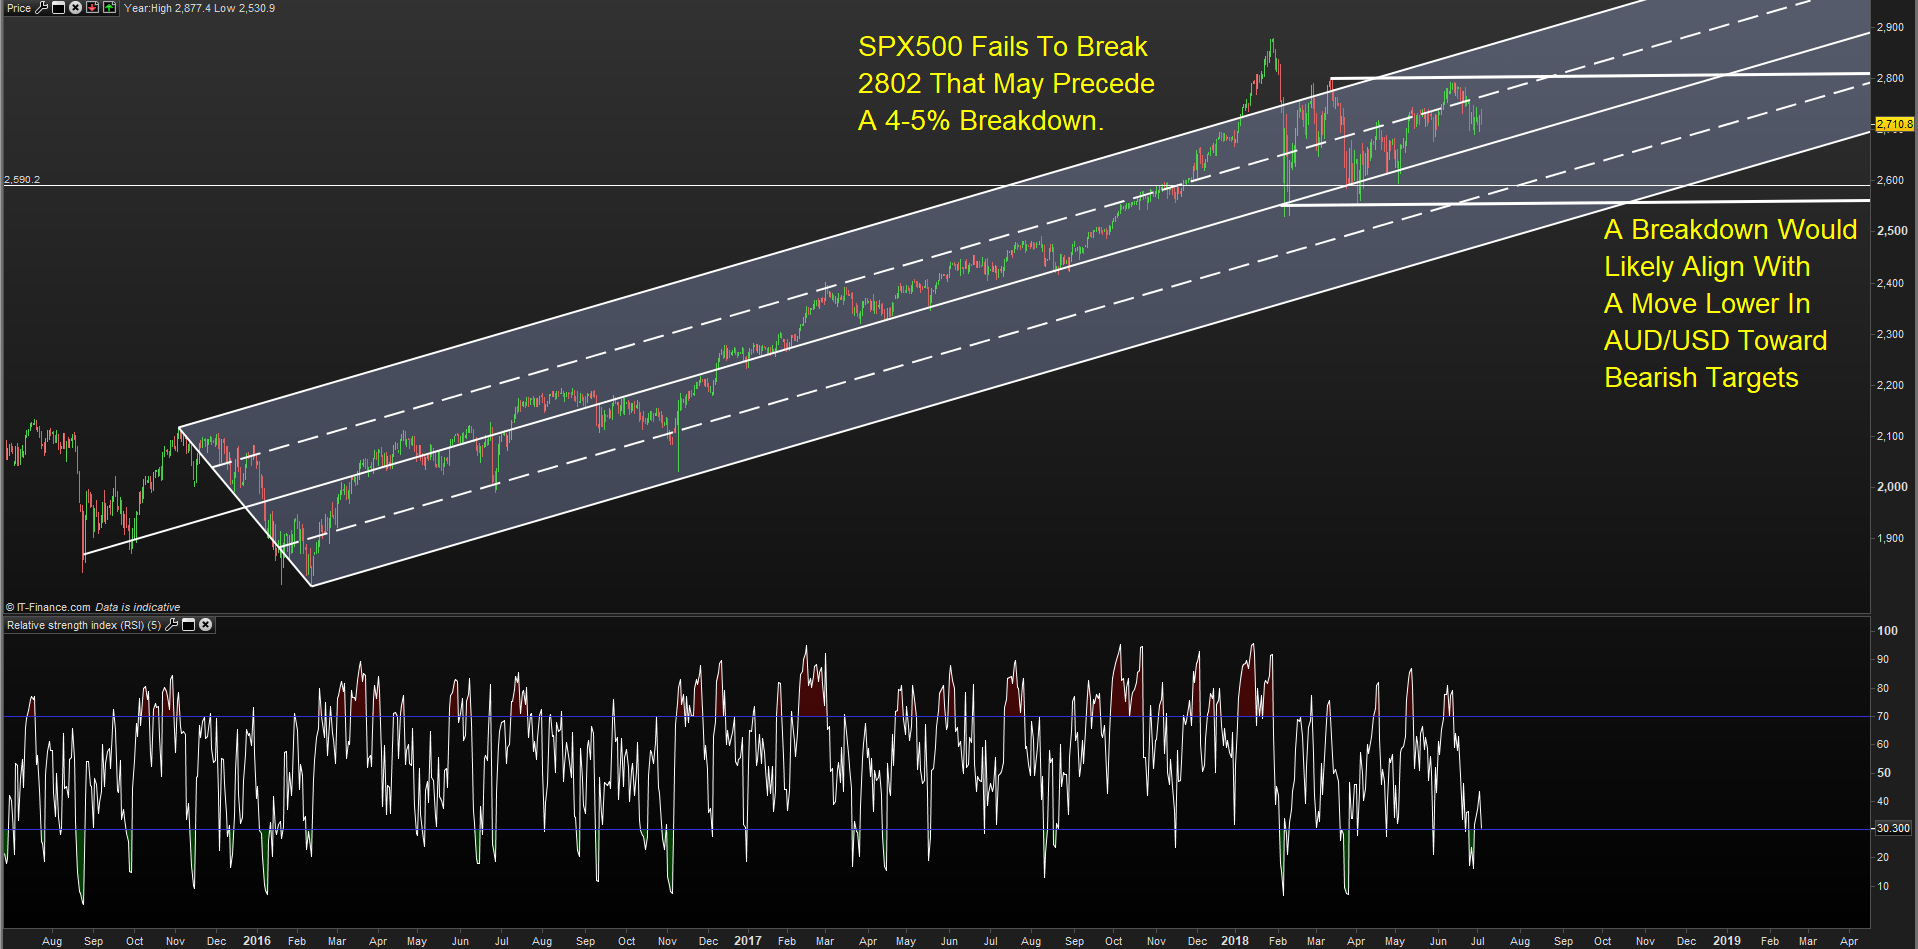
Chart Source: Pro Real Time with IG UK Price Feed. Created by Tyler Yell, CMT
If yields are to fall, it’s typically a safe bet to view that SPX500 would also fall. The chart above shows the SPX500 with a channel drawn around key pivots in 2015/2016 that has framed price action well except for the overshoot in January 2018.
If the market did, in fact, overshoot, then we may be due for a breakdown toward the bottom of the channel while preserving the overall uptrend. Such a breakdown toward 2,550 would mean a 5.5% drop from the spot price would likely bring AUD/USD lower, and fulfill the trading ideas Target 2.
On the other hand, a break above 2,800 would likely negate the bearish view on equities, yields and AUD/USD and could be a move toward 3,000 on the major index though this does not stand as my base case with the trade war talks only escalating.
More For Your Trading:
Are you looking for longer-term analysis on the U.S. Dollar? Our DailyFX Forecasts for Q2 have a section for each major currency, and we also offer an excess of resources on USD-pairs such as EUR/USD, GBP/USD, USD/JPY, AUD/USD. Traders can also stay up with near-term positioning via our popular and free IG Client Sentiment Indicator.
Forex Trading Resources
DailyFX offers a surplus of helpful trading tools, indicators, and resources to help traders. For those looking for trading ideas, our IG Client Sentiment shows the positioning of retail traders with actual live trades and positions.
Our trading guides bring our DailyFX Quarterly Forecasts and our Top Trading Opportunities, and our real-time news feed has intra-day interactions from the DailyFX team. And if you’re looking for real-time analysis, our DailyFX Webinars offer numerous sessions each week in which you can see how and why we’re looking at what we’re looking at.
If you’re looking for educational information, our New to FX guide is there to help new(er) traders while our Traits of Successful Traders research is built to help sharpen the skill set by focusing on risk and trade management.
---Written by Tyler Yell, CMT
Tyler Yell is a Chartered Market Technician. Tyler provides Technical analysis that is powered by fundamental factors on key markets as well as t1rading educational resources. Read more of Tyler’s Technical reports via his bio page.
Communicate with Tyler and have your shout below by posting in the comments area. Feel free to include your market views as well.
Discuss this market with Tyler in the live webinar, FX Closing Bell, Weekdays Monday-Thursday at 3 pm ET.
Talk markets on twitter @ForexYell


