


Point to Establish Long Exposure: At Market
Spot: 2052
Target 1: 2,137 2015/ All-Time High
Target 2: 2,250 61.8% of Wave 1 Off March 9, 2009, Low – May 2011 High
Invalidation Level: Close below 2,033 (April Low)
One great tip I’ve picked up working with Kristian Kerr over the years is to ask yourself, “what is the contentious idea in markets right now?” In other words, what move is being fought by “well-minded” investors? This question and the idea gets to the core of why the Speculative Sentiment Index can be such an effective and simple indicator.
As we go into the “Sell in May & Go Away” season for stocks, a breakout could disrupt the typical pattern and align with a move to new highs this summer, which this analyst pick is focusing.
Fundamental & Technical Focus:
The move higher from late mid-February that is labeled ‘c/4’ on the chart below has been relentless. In a few months, the SPX500 has catapulted ~17%. Such a strong move has typically rolled over as we’ve seen a range develop in the SPX500 since the late 2014 Fixed-Income Flash Crash on October 15.
However, a breakout through resistance in the 2,116-2,137 area could move higher as we have two narratives playing out that we have not heard in some time. Those narratives are a relatively weak US Dollar and strong WTI Crude Oil [CFD:USOil].
Both factors could provide an unusual lift to the equity markets that should be watched. While much of the gains in the index have been led by high-growth names commodity based companies are seeing new revenue growth that has been absent for some time. Additionally, given the multi-national operations that nearly all of these companies employ, a weaker US Dollar significantly increases the ease of doing business offshore.
Chart:

The chart above takes a price channel, specifically Andrew’s Pitchfork, and draws it from the key pivot in the bottoming process of late-2008 and extends the upper and lower parallel from key pivots in 2011.
I was impressed how the resistance held on the way higher through 2014-2015. Now, you can see we’ve recently bounced aggressively from the bottom parallel to the median line. If the factors mentioned above (Weak us dollar / strong WTI Crude Oil) do in fact help stocks get their next boost, we could soon see a potential move to the top of the channel. The top of the channel registers around ~2,300-2,450.
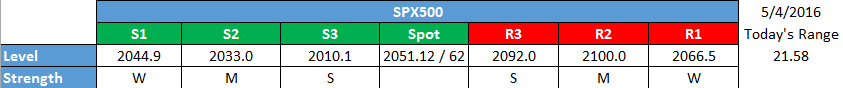
SPX500 Resistance & Support Levels
2nd resistance: 2,116.4 November High
1st resistance: 2,137 2015/ All-Time High
Spot: 2050
1st support: 2033 April Low
2nd support: 2010 200-Day Moving Average
Trade Setup:

Buying into resistance isn’t my idea of a reasonable trade. The 200-dma and recent lows from April will continue to be in focus for holding up the price if we’re going to see a sustainable move higher.Due to the push higher from February 11, I believe we could maintain a move higher that eventually tests and breaks the November high if the support can hold.
Another Andrew’s Pitchfork worth watching on the chart above is the larger channel in red drawn off a momentum peak in 2014 and two extremes in H2 2015. The channel performs much the same function as a corrective bull-flag. A bull flag is a famous trend continuation pattern, and when resistance is broken as it appears to have been, the trend may be in early stages of a breakout. Such a breakout would favor entering long with sights set beyond the 2015 highs. The stops could be set at either the 200-DMA or more preferably for me, the April low of 2033.1.
This target aligns with a favorable risk: reward ratio that our Traits of Successful Traders report found to be one of the best things a trader can do to ensure long-term sustainability in your trading. The October low would be the eventual target though a failure at the 200-dma can send a market multiple % points in the direction of the failure.
FX Strong/ Weak As of Tuesday, May 2, 2016

For those interested in shorter-term levels of focus than the ones above, these levels signal important potential pivot levels over the next 48-hours.
Interested In our Analyst’s Longer-Term Dollar Outlook? Please sign up for our free dollar guide here.


