


USD Technical Outlook
- US Dollar Index (DXY) inverse head-and-shoulders pattern
- EUR/USD rolling over and challenging the March trend-line
USD pattern, trend-line break would be bullish
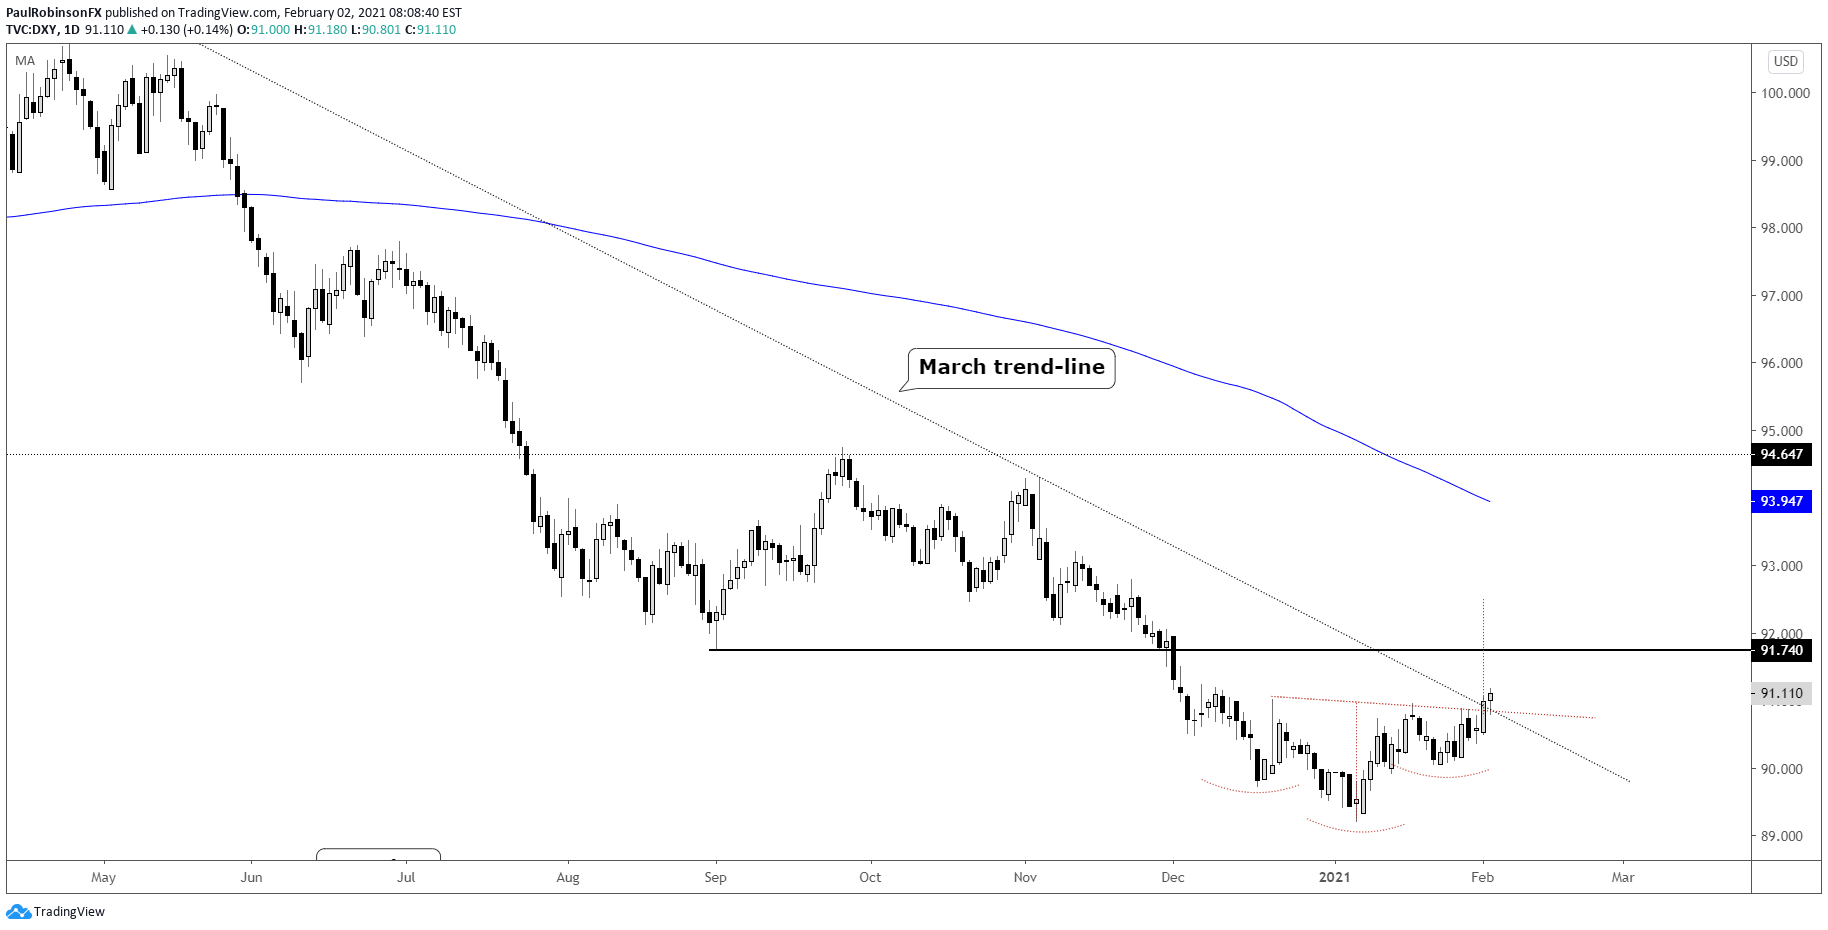
The US Dollar Index (DXY) is on the verge of turning higher as it tries to round its way out of an inverse head-and-shoulders (H&S) formation. Adding additional weight to the significance of this pattern is the March trend-line in confluence with the neckline of the H&S pattern.
At the moment price is starting to poke above the confluent threshold, and should it firmly close above there today (or very soon if knocked back lower near-term), then the bullish trading bias will continue to gain further traction.
The first big level to watch on a breakout arrives at the September 1 low at 91.74, and will be an important threshold to cross if the rally is to at least meet or exceed the measured move implied by the depth of the inverse head-and-shoulders. That move would be to around 92.50 or higher.

US Dollar Index (DXY) Daily Chart (inverse H&S)
If the DXY is turning higher then the index’s most heavily weighted constituent, EUR (57.6% weight), is turning lower. The “anti-dollar”. It has been rolling down out of a head-and-shoulder type pattern as well, and it even broke a little bear-flag recently.
This has the May trend-line in focus, which is the equivalent of the DXY’s March trend-line. A break below is seen as potentially accelerating the move lower if the September 1 high, which is almost in confluence, can break as well.
A breakdown beneath 12011 is seen as the real level to trade below to increase odds in favor of sellers. A hold of support would not necessarily turn the outlook bullish, but it would be prudent to take a neutral stance at the least. Support is support until broken. To turn the picture bullish some work will need to be done.
EUR/USD 4-hr Chart (12011 support)

Resources for Forex Traders
Whether you are a new or experienced trader, we have several resources available to help you; indicator for tracking trader sentiment, quarterly trading forecasts, analytical and educational webinars held daily, trading guides to help you improve trading performance, and one specifically for those who are new to forex.
---Written by Paul Robinson, Market Analyst
You can follow Paul on Twitter at @PaulRobinsonFX


