EUR/JPY Highlights:
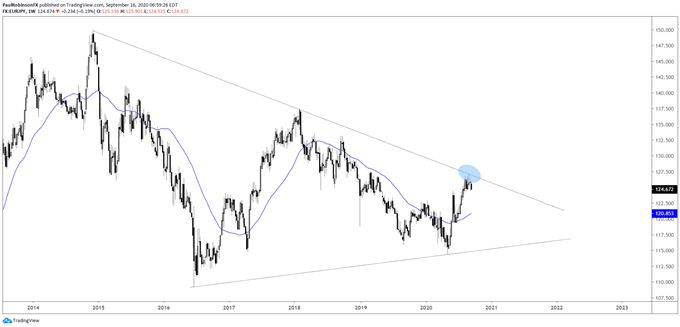
- EUR/JPY recently rose into long-term trend-line resistance
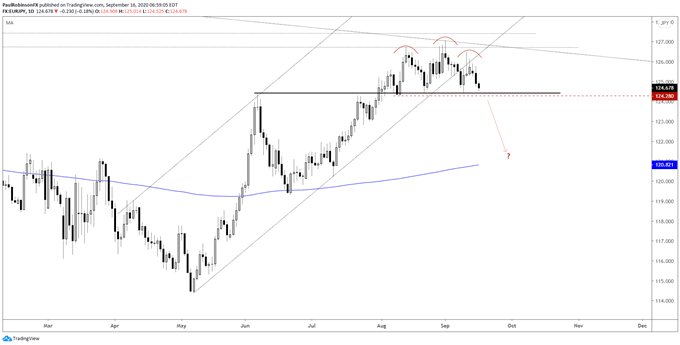
- Price action on daily looks ‘toppy’, watch strong support at its feet
To end last month EUR/JPY tagged a trend-line running lower since December 2014, and since then it has shown signs of rolling over. Price action over the last month is taking on the shape of a head-and-shoulders (H&S) pattern with a strong neckline.
The neckline support originated as a top back in early June. Since then it became support twice in August and again last week. A closing daily candle below 12428 is seen as triggering the H&S formation. Based on the height of the pattern a measured move from the neckline of ~300 pips could unfold in fairly rapid fashion.
The key to this set-up is waiting for support to break, otherwise it is to be respected as support for as long as it holds. The would-be H&S pattern could turn into a congestion pattern that never officially provides a bearish trigger. In which case we would need to reassess and possibly turn to a bullish bias if further developments warrant such a stance.


EUR/JPY Weekly Chart (2014 trend-line resistance)

EUR/JPY Daily Chart (H&S w/strong neckline)

Resources for Forex Traders
Whether you are a new or experienced trader, we have several resources available to help you; indicator for tracking trader sentiment, quarterly trading forecasts, analytical and educational webinars held daily, trading guides to help you improve trading performance, and one specifically for those who are new to forex.
---Written by Paul Robinson, Market Analyst
You can follow Paul on Twitter at @PaulRobinsonFX


