


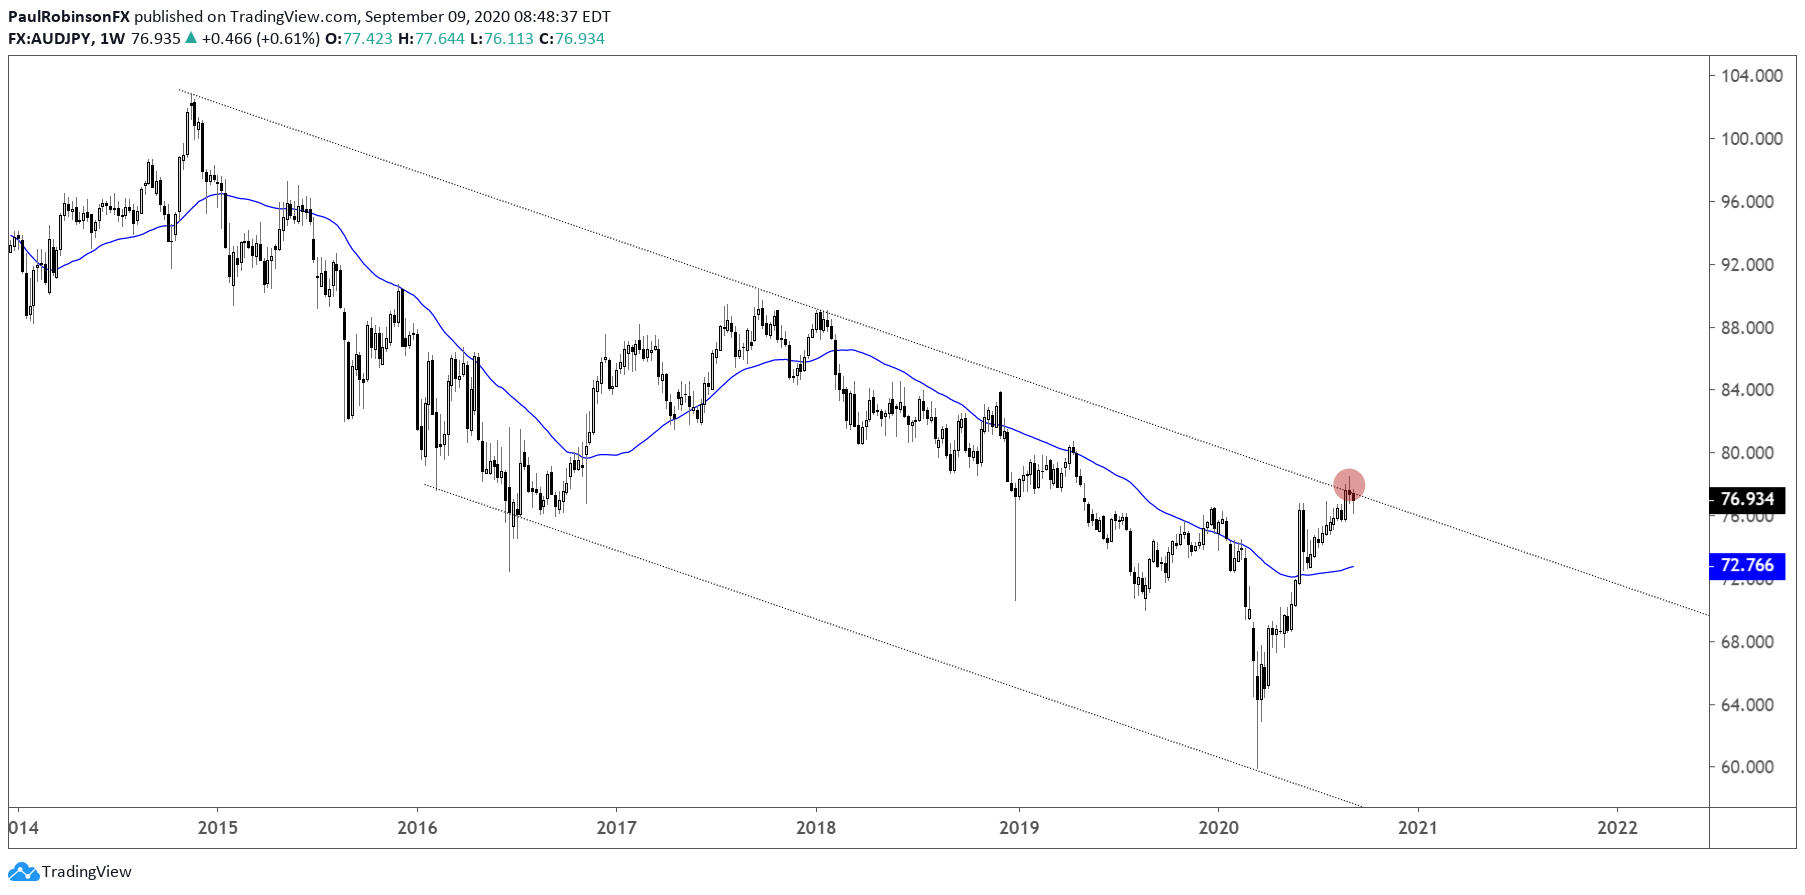
AUD/JPY Highlights:
- AUD/JPY at top of long-term downward channel
- Near-term at a big spot with ascending wedge nearly broken
AUD/JPY had a nice ascending wedge going for it not too long ago, a pattern highlighted as giving the pair breakout potential. The lean was towards the upside given the pattern, and that we got, but there was also a question of how sustainable that breakout could be given long-term resistance.
So far those concerns are being validated as the wedge broke and price sagged back to the underside trend-line of the wedge. This is an important spot, because if support can hold then so can the upward bias towards another attempt to break the long-term downtrend line.
But if the lower side of the pattern breaks the move down could be even more powerful than a move up. First, you have that long-term resistance within a downward channel that suggests the long-term trend is down. Secondly, failed pattern breakouts can lead to an mass exodus with the crowd leaning the wrong way during the congestion phase that created the pattern in the first place.
Support is support until broken, and we have yet to see that happen. Using the overnight low at 76.11 as the level to watch. Stay above and a push higher could ensure, however, if it breaks then we should see AUD/JPY start to accelerate lower as the long-side of the market finds itself on its backfoot, with 72.52 (bottom of the wedge) as the first big target.

AUD/JPY Weekly Chart (big line of resistance)
AUD/JPY 4-hr Chart (keep an eye on the lower line of wedge)

Resources for Forex Traders
Whether you are a new or experienced trader, we have several resources available to help you; indicator for tracking trader sentiment, quarterly trading forecasts, analytical and educational webinars held daily, trading guides to help you improve trading performance, and one specifically for those who are new to forex.
---Written by Paul Robinson, Market Analyst
You can follow Paul on Twitter at @PaulRobinsonFX


