


USD/CAD Highlights:
- USD/CAD breaks multi-week range, below 200-day
- Break in-line with trend, looking to June low, 2017 trend-line
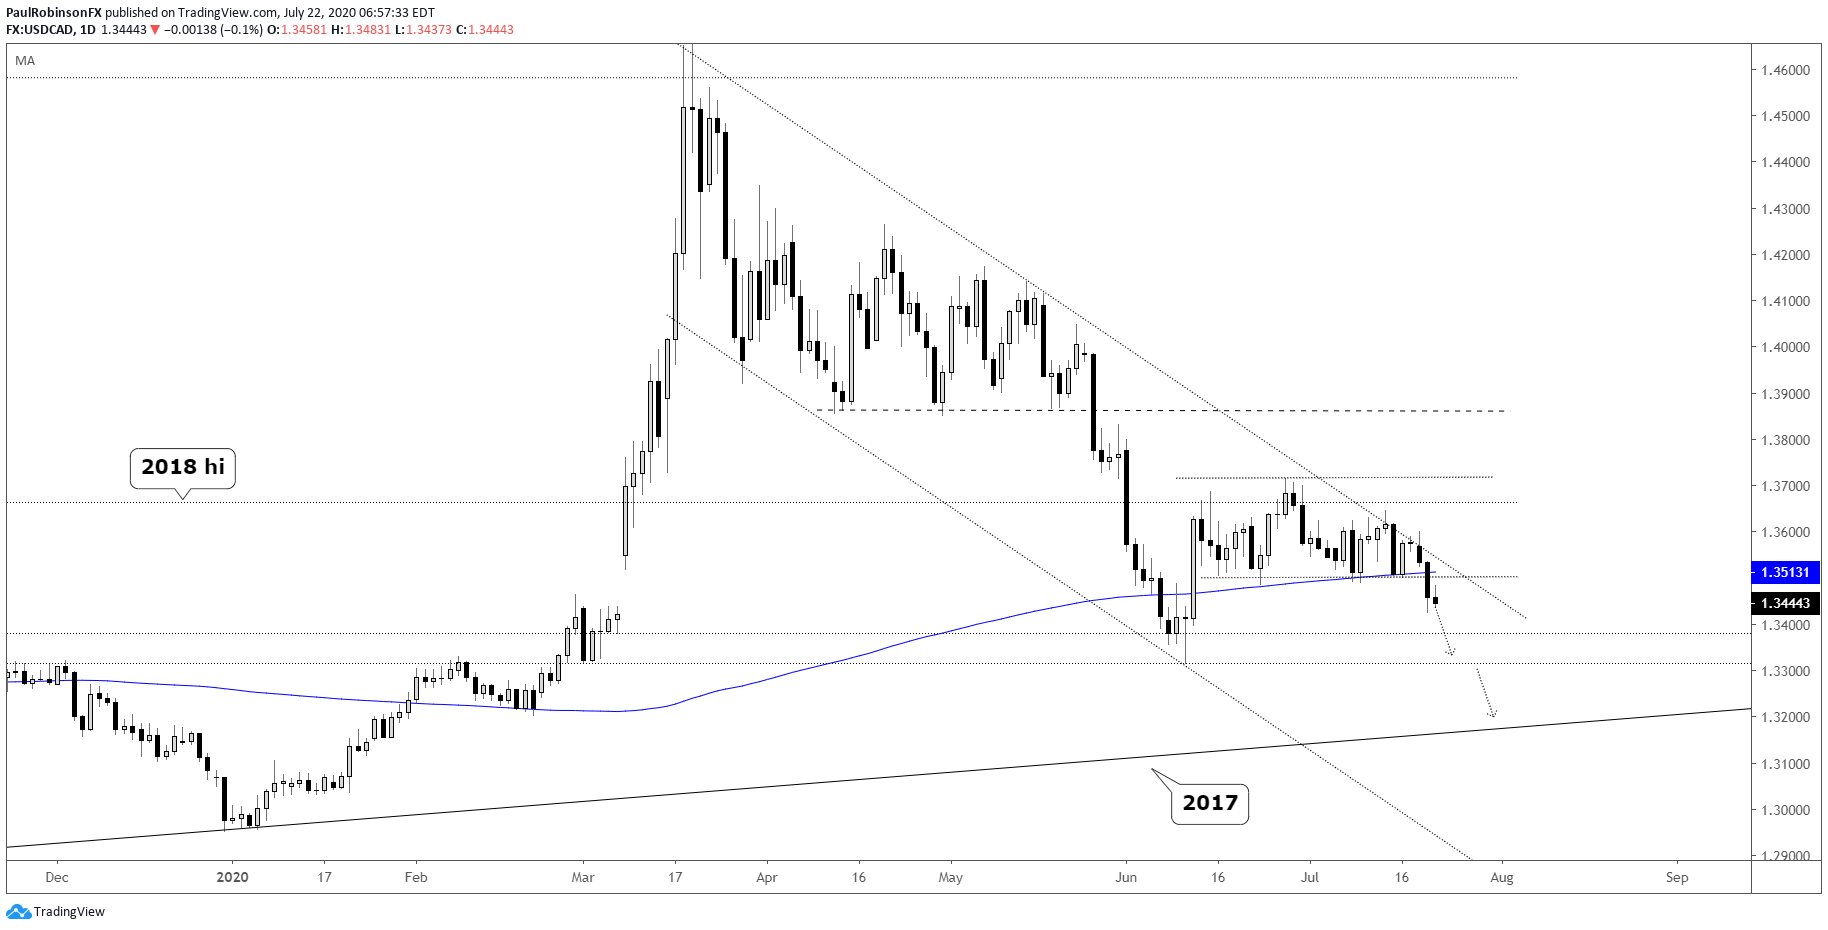
USD/CAD underwent a five-week-long sideways move that finally broke yesterday with price closing below 13458. The lower boundary of the range was built upon the 200-day MA, with several turns higher making for increasingly important support. Broken support now becomes resistance.
Looking lower the next level of solid support arrives around the June lows; intra-day low at 13315 and lowest daily close at 13380. A break through the lows will have the 2017 trend-line up next as the targeted objective. The trend-line connects not only the 2017 low, but also the 2018 and 2019 troughs, making it a big spot should price fall to that point. It lies around ~13200.
To negate the bearish outlook and possibly turn USD/CAD bullish, it needs to break solidly back inside the range and above the upper parallel/trend-line running off the March high. This could have a spark effect as the market is caught leaning the wrong way. But until evidence of a reversal develops, running with a short bias looks to be the most prudent play for now.

USD/CAD Daily Chart (broke range)
***Updates will be provided on the above thoughts and others in the trading/technical outlook webinars held at 930 GMT on Tuesday and Friday. If you are looking for ideas and feedback on how to improve your overall approach to trading, join me on Thursday each week for the Becoming a Better Trader webinar series.
Resources for Forex & CFD Traders
Whether you are a new or experienced trader, we have several resources available to help you; indicator for tracking trader sentiment, quarterly trading forecasts, analytical and educational webinars held daily, trading guides to help you improve trading performance, and one specifically for those who are new to forex.
---Written by Paul Robinson, Market Analyst
You can follow Paul on Twitter at @PaulRobinsonFX


