Struggling right now? It happens to the best. Check out these four core ideas to help boost your Confidence as a Trader.
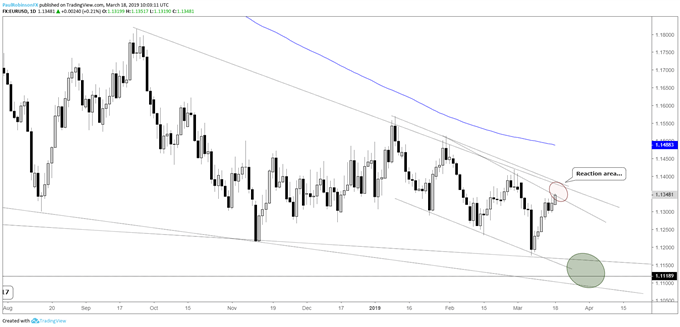
EURUSD trend-line resistance puts it at risk of turning lower
Thus far this year, the Euro, during these times of unusually low volatility, has seen each rally and sell-off reversed, and until this pattern shows signs of changing I will continue to run with this sequence as the overarching theme to work with.
With that said, if the sequence is to continue then we should see EURUSD turn lower again soon. There is trend-line resistance of a couple of degrees which could put in a top. From here up to the 11380s or so should prove to be problematic.
A convincing turn lower in momentum will be needed for a high conviction set-up. Once a turn lower develops, if one does indeed develop, then the high of the candlestick will be used to determine stops for trades back down to sub-11200 where a few lines of support intersect.
What will bring pause to the continuation of the multi-month sequence, is if we either a.) see the Euro rip through resistance or b.) pull off from it, but hold and then breakout on through. This would be reason to flip the script on how to approach the Euro.
Looking for Trading Forecasts and Education to assist you in your trading? We’ve got you covered on the DailyFX Trading Guides page.
EURUSD Daily Chart (t-line resistance)

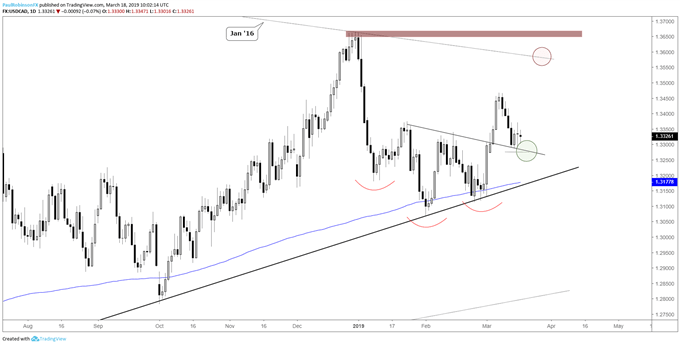
USDCAD testing neckline of inverse head-and-shoulders pattern
USCAD charged through the neckline of an inverse head-and-shoulders pattern on March 5, but is now in full ‘neckline retest’ mode. A low may have been posted last week at 13286. It’s the first low I’m using as a reference point, but should we see one more jab lower and recovery, that could make for a new low from which to place stops during the retesting process. On a move higher from here the January 2016 trend-line and the December 31 high at 13664 will be targeted.
USDCAD Daily Chart (Retesting neckline of inverse H&S)

***Updates will be provided on these ideas and others in the trading/technical outlook webinars held on Tuesday and Friday. If you are looking for ideas and feedback on how to improve your overall approach to trading, join me on Thursday each week for the Becoming a Better Trader webinar series.
Resources for Forex & CFD Traders
Whether you are a new or experienced trader, we have several resources available to help you; indicator for tracking trader sentiment, quarterly trading forecasts, analytical and educational webinars held daily, trading guides to help you improve trading performance, and one specifically for those who are new to forex.
---Written by Paul Robinson, Market Analyst
You can follow Paul on Twitter at @PaulRobinsonFX


