USD/JPY Price Forecast, Analysis and Chart:
- USD/JPY rally looks like it has further to go.
- Fundamental risk-on move weighs on the Japanese Yen.
USD/JPY Heading for the Next Fibonacci Retracement Level
USD/JPY continues to turn higher, aided by a global risk-on move as US-Iran tensions ease and ahead of Wednesday’s signing of the first phase US-China trade deal. News that the US has taken China off its currency manipulator list has given the pair another boost higher and looks set to keep the rally going.


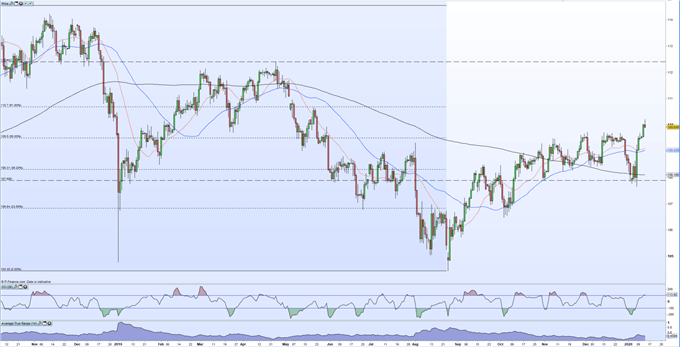
Recent price action has seen USD/JPY break above a confluence of resistance levels made over the last few weeks. The old highs and the 50% Fibonacci retracement made up a strong resistance zone between 109.50 and 109.75 that held until this week. The clear break through this zone, and the open above today, adds credibility to the pair moving higher and back to levels seen late-May last year. The next Fibonacci retracement level is at 110.70 before the April 24 swing high at 112.403 comes into play.
USD/JPY Support Close at Hand
Initial support down to the 109.50 level before the 20- and 50-day moving averages at 109.10 and 109.03. A breakdown through these level opens the way to the 38.2% fib retracement level at 108.31 which may prove difficult to break in the current climate. The pair trade above all three moving averages, a positive signal, while the CCI indicator is just touching overbought levels, which may temper a move higher in the short-term.
USD/JPY Daily Price Chart (January 2019 - January 14, 2020)


Traders may be interested in two of our trading guides – Traits of Successful Traders and Top Trading Lessons – while technical analysts are likely to be interested in our latest Elliott Wave Guide.
What is your view on the Euro and the US Dollar – bullish or bearish?? You can let us know via the form at the end of this piece or you can contact the author at nicholas.cawley@ig.com or via Twitter @nickcawley1.


