


NZDCAD – Pending Short at 92.55 – Recent December highs.
Stop Loss – 93.80
Target 1 (50%) – 91.10 – 50% Fibonacci retracement.
Target 2 (50%) – 89.20 – 61.8% Fibonacci retracement.
The DailyFX Q4 Forecast s are available to download.
NZDCAD – Long-Term Down Trend Remains in Place
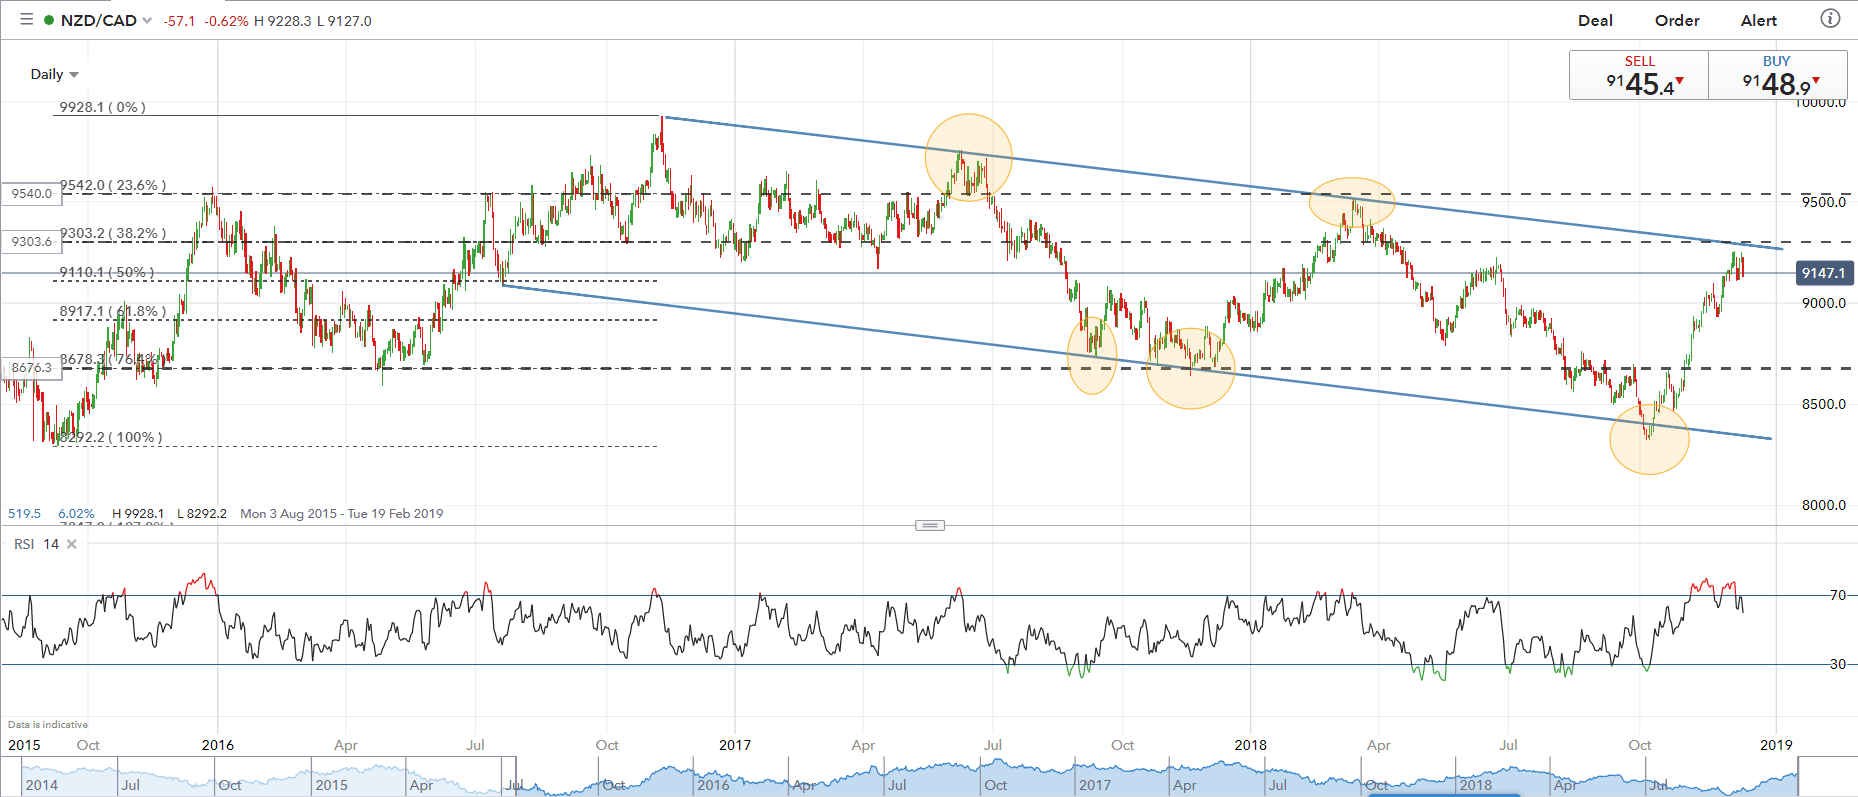
The recent oil bear market hit the Canadian dollar hard and against the New Zealand dollar sent it back to the bottom of the NZDCAD downtrend, started from the November 9, 2016 high at 99.28. Since then the chart has been dominated by lower highs and lower lows. The chart below shows the downtrend crossovers with the various Fibonacci retracement levels of the September 2015 – November 2016 rally where price action reversed. The current spot level – 91.48 - is nearing both the upper line of the downtrend around 93.00 and the 38.2% Fibonacci retracement level at 93.03 and is likely to provide a reversal point.
In addition, the RSI indicator – at the bottom of the chart – has just eased out of overbought territory. The previous times the RSI indicator showed either overbought or oversold levels, the price reversed back into the trend channel.
NZDCAD Daily Price Chart (August 2015 – December 13, 2018)
IG Client Sentiment Data show how retail traders are positioned in a wide range of financial products and how this can help you when you trade.
Traders may be interested in two of our trading guides – Traits of Successful Traders and Top Trading Lessons – while technical analysts are likely to be interested in our latest Elliott Wave Guide.
What is your view on NZDCAD – bullish or bearish?? You can let us know via the form at the end of this piece or you can contact the author at nicholas.cawley@ig.com or via Twitter @nickcawley1.


