Check out our New Trading Guides: they’re free and have been updated for the second quarter of 2018
USDJPY Short-Term Sell-Off Does Not Change the Medium-Term Trend
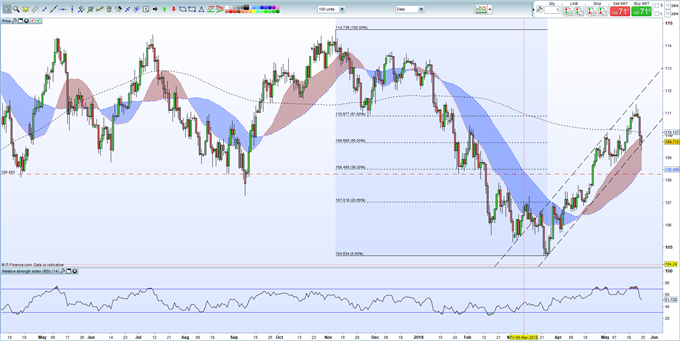
The latest risk-off move has seen USDJPY move sharply lower and test the lower boundary of the uptrend started in late-March. The news Wednesday that the US has launched a national security investigation into car and truck imports, sparked fears of a new round of tariffs. With potential trade wars back in the headlines, the safe-haven JPY received a boost, despite the negative effect any new tariffs would have on the Japanese automobile sector.
USDJPY has rallied off a low of 104.634 on March 25 and peaked at 111.398 on May 21. This solid uptrend is currently being tested around the 109.680 which coincides with the 50% Fibonacci retracement of the December 6 to March 25 move. The pair have also just broken below the 200-day moving average around 110.165.
Fundamentally the US dollar remains strong with another two or potentially three 0.25% interest hikes expected in 2018, with the next one a near certainty in June. The interest-rate sensitive 2-year UST currently yields 2.525%, just off its recent near-decade high at 2.595%, and further downside yield moves are likely to be very limited.
To give us flexibility and protection for a further escalation of any negative trade news, we would look to buy USDJPY at the 50% Fibonacci retracement level around 108.493. On the upside we will place two profit targets of 109.70 and 110.80 along with a tight stop-loss at 107.70 – just below the top of the reverse head and shoulder on the April 23 bull candle.
The IG Client Sentiment Indicator shows retail are 51.2% long USDJPY – normally a mildly bearish contrarian indicator – but recent changes in positioning highlight a mixed trading bias.
USDJPY Daily Price Chart (April 2017 – May 24, 2018)

Entry Point: 108.500.
Target 1: 109.70.
Target 2: 110.80.
Stop-Loss: 107.70.
--- Written by Nick Cawley, Analyst
To contact Nick, email him at nicholas.cawley@ig.com
Follow Nick on Twitter @nickcawley1


