


- Join Michael for Live Weekly Trading Webinars on Mondays on DailyFX at 12:30 GMT (8:30ET)
- See our new 4Q projections in the DailyFX Trading Forecasts.
- Click Here to be added to Michael’s email distribution list.
Here's an update on a few of the setups we’ve been tracking this week. Find a detailed, in-depth review of these setups and more in this week’s Strategy Webinar.
AUD/USD Weekly Chart

For the past few weeks we’ve been tracking this key support barrier in Aussie at 7630- ‘a region defined by the 38.2% retracement of the 2016 advance, the 61.8% retracement of the May advance and the 52-week moving average.’ The pair has continued to struggle here and post-RBA, the focus remains on a reaction off this critical threshold.
A weekly close below this region risks a decline into the 2016 trendline support / 50% retracement at 7476. A near-term recovery above 7743 would be needed to alleviate further downside pressure. Bottom line: the immediate downside bias is at risk while above this key support zone.
New to Forex? Get started with our Free Trading Guide !
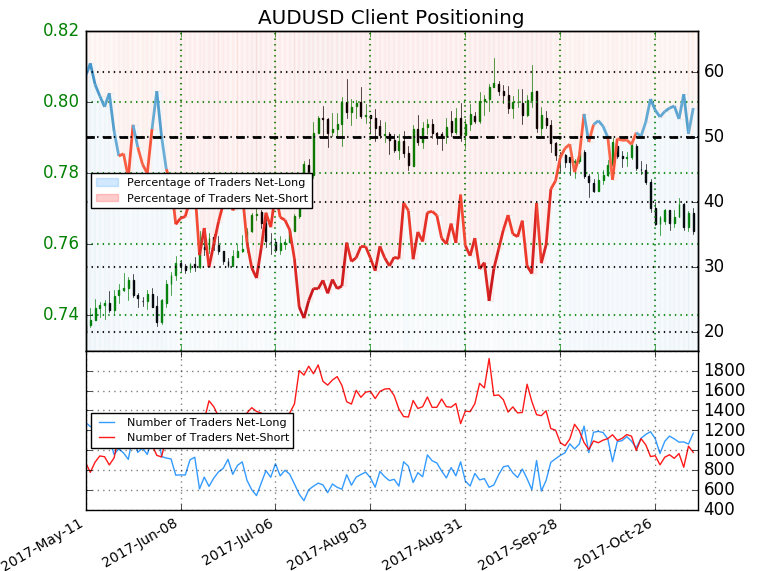
- A summary of IG Client Sentiment shows traders are net-long AUDUSD- the ratio stands at +1.2 (54.5% of traders are long) – Weak bearishreading
- Long positions are 4.1% higher than yesterday and 2.1% higher from last week
- Short positions are 8.1% lower than yesterday and 2.7% lower from last week
- We typically take a contrarian view to crowd sentiment, and the fact traders are net-long suggests AUDUSD prices may continue to fall. Traders are further net-long than yesterday and last week and the combination of current positioning& recent changes gives us a stronger AUDUSD-bearish contrarian trading bias from a sentiment standpoint.
See how shifts in AUD/USD retail positioning are impacting trend- Click here to learn more about sentiment!
Crude: An in-depth multi-timeframe examination of crude in today’s Scalp Report highlights the risk for a near-term pullback as prices continue to press fresh two-year highs. That said, the broader focus remains constructive and I’d be looking to fade weakness while above 53.80 targeting key resistance targets at 59.12 & 60.
Learn the traits of a successful trader in this Free eBook!
USD/JPY 240min Chart

USDJPY continues to hold below critical near-term resistance at 114.30/50. An early-week attempt failed and shifts the immediate focus on a break of the 113.44-114.50 range for further conviction on the near-term directional bias (break lower favored).
Join Michael on Fridays for his bi-weekly Webinar on the Foundations of Technical Analysis- Register for Free Here!
---Written by Michael Boutros, Currency Strategist with DailyFX
Follow Michaelon Twitter @MBForex or contact him at mboutros@dailyfx.com


