EURGBP price, news and analysis:
- The EURGBP price has been trending lower since late August but has now risen above the resistance line joining the lower highs and, if it can hold on to its gains, should make further progress.
- That is despite a senior EU legal adviser saying the UK has the right to withdraw its Brexit divorce petition, making no-Brexit possible if a proposed EU-UK deal is rejected by the UK Parliament.
Positive technical signal for EURGBP price
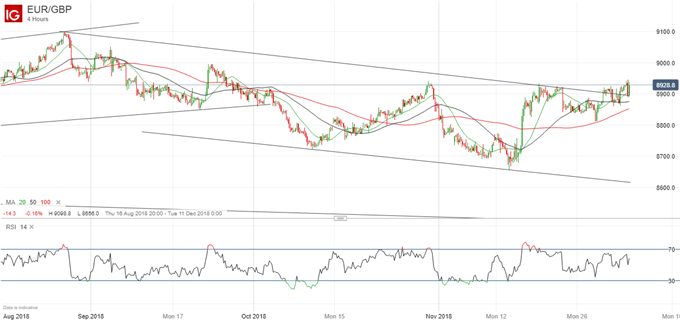
The EURGBP price has risen above a downward channel in place since late August, making a move higher likely. So far, the break is looking tentative so it might be wise to wait for it to be confirmed before going long the pair but, if it is confirmed, the advance could be strong.
EURGBP Price Chart, Four-Hour Timeframe (August 16 – December 4, 2018)

Chart by IG (You can click on it for a larger image)
As the four-hour chart above shows, the pair first broke above trendline resistance last Thursday, moved back below it and has now breached it again. That is clearly positive, especially as GBP is currently benefiting from a legal judgment that the UK can overturn its decision to exit the EU if it wishes to.
A confirmed break would bring 0.90 into view and, if that can be reached, the next target would be the high just under 0.91 touched on August 28. Meanwhile, the downside is protected by the 20-day moving average at 0.8859, the 50-dma at 0.8822, the 100-dma at 0.8881, the October 10 low at 0.8723 and the November 13 low at 0.8656.
Resources to help you trade the forex markets:
Whether you are a new or an experienced trader, at DailyFX we have many resources to help you:
- Analytical and educational webinars hosted several times per day,
- Trading guides to help you improve your trading performance,
- A guide specifically for those who are new to forex,
- And you can learn how to trade like an expert by reading our guide to the Traits of Successful Traders.
--- Written by Martin Essex, Analyst and Editor
Feel free to contact me via the comments section below, via email at martin.essex@ig.com or on Twitter @MartinSEssex


