


NZDUSD Talking Points
- The Dollar has broken lower from a historically restrictive two-month range despite a building interest rate forecast
- While there is appeal to be found in pairs like EURUSD, USDJPY and USDCAD; NZDUSD may be in the best position to benefit a swoon in US rate premium
- On the technical side, the short-term chart reflects an inverse head-and-shoulders pattern with a neckline at 0.6850/60

If we were to evaluate an exchange rate purely on the interest rate differentials between the two component currencies, NZDUSD would have established itself a fairly consistent bullish trajectory. In reality, speculative markets are forward looking, attempting to project changes in values like interest rates, growth and risk trends. Through the fourth quarter of 2021, the interest rate forecast for the Fed soared and so too did the Greenback…for a while. Eventually, the momentum flagged for the benchmark currency, turning it to an extended period of congestion. That congestion seems to have been resolved this past session through measures like the DXY trade weighted index, EURUSD and USDCAD. Technically, the break hasn’t been secured for NZDUSD with the most restrictive 35 day (7-week) range since 1997. As the saying goes: ‘it’s a little too quiet’. A break is likely to come for this cross as it has with its more liquid counterparts, and the hawkish contrast that the Kiwi offers a stronger fundamental backdrop should the technical cue trigger.
Chart of NZDUSD with 200-Week SMA and 7-Week Historical Range (Weekly)
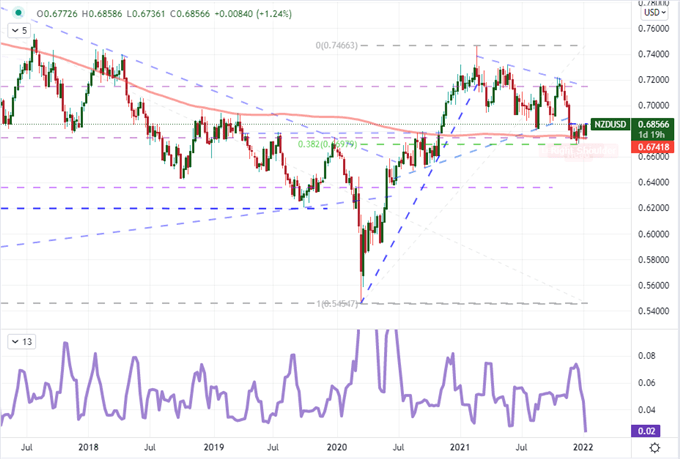
Chart Created on Tradingview Platform
From the weekly chart, there seems to be more recent historical range to the downside below 0.6700 than above 0.6900, but it is important to take all of the elements into consideration. Risk trends are still positive, the New Zealand dollar has a higher yield than its US counterpart and it is far more likely that the Fed moderates rather than the RBNZ. Turning the dial down to a daily chart, the technicals present another measure of confirmation that can build my sense of conviction. An inverse head-and-shoulders pattern has developed over the previously mentioned period of consolidation with a fairly overt neckline at approximately 0.6860 – a level that happens to currently coincide with the 50-day moving average.
I like H&S (and inverse H&S) patterns as they are so straightforward. They don’t always work out of course – as with any layout it is just probabilities – but the levels can contribute to establishing a sense of conviction. One of the most important aspects to this reversal pattern is the trend that precedes the consolidation period. The drop from the Oct 28th high to the Dec 20th low is a hefty one, which loads more potential for a turn should it take. For further levels to consider, the midpoint of the same range is 0.6960 and the 200-day SMA stands at 0.7020. When I trader reversals, I usually look for a percentage of the range and almost never the entire historical swing. Having a time frame and points for taking partial profits has also been helpful for me with such scenarios.
| Change in | Longs | Shorts | OI |
| Daily | 6% | -13% | 2% |
| Weekly | 40% | -35% | 15% |
Chart NZDUSD with 50-Day SMA (Daily)
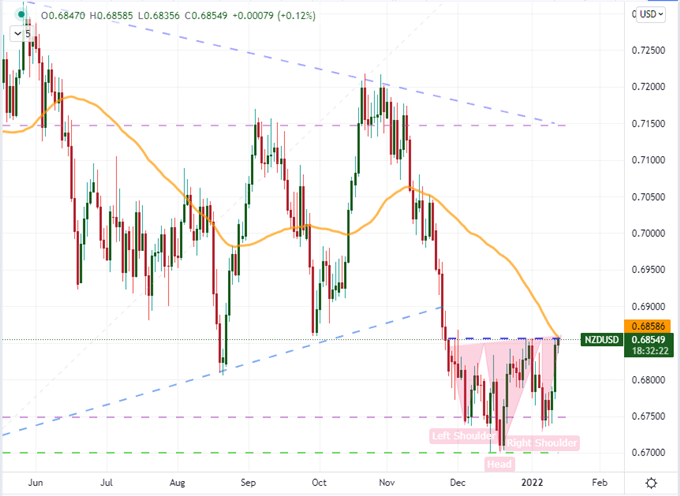
Chart Created on Tradingview Platform


