


Japanese Yen Talking Points:
- The Yen has been relatively quiet of late, following a massive bearish trend in the first-half of this year. Yen weakness has started to re-appear but the big question is one of continuation potential.
- USD/JPY has continued with bullish movement but seems more-related to the USD bullish trend. Notably, USD/JPY is working on a lower-high as USD challenged its prior 19-year high.
- EUR/JPY, GBP/JPY and AUD/JPY are all showing consolidation – which could lead to outsized moves at some point once Yen trends take-over again.
- The analysis contained in article relies on price action and chart formations. To learn more about price action or chart patterns, check out our DailyFX Education section.

The Japanese Yen was very much a hot-button topic through the first half of this year, particularly in Q2. As US rates were rising, so was demand for carry trades, and in FX the Japanese Yen had a particular attraction for such as the negative rate policy at the Bank of Japan has remained since 2016. So, as US rates were rising, so was USD/JPY, driven by both the higher rates in the USD and the low/negative rate regime in JPY.
Traders and investors were on guard for any subtle sign of change. When US rates began to fall in the middle of July right after the release of CPI, USD/JPY went along with it as carry trades unwound. And this highlights a theme that could garner extreme interest in the not-too-distant future and it’s something we’ve seen before.
In 2012 Shinzo Abe took the economic world by storm with his ‘three pillars’ approach to economic policy. The design was to artificially weaken the Yen, which could then allow for tax and policy reforms in Japan as the nation looked to reverse decades of slow growth. This trend ran from 2012 and into 2015, finally starting to see a bit of turbulence that summer as Chinese equity markets began to shake violently.
That led to an aggressive sell-off in USD/JPY. From February to June of 2016, the pair fell by more than 2,000 pips, eventually finding support at the psychological level of 100. That was a trend that took a year to build, from the summer of 2014 into the summer of 2015, and it all went away in about four months: Up the stairs, down the elevator.
At the source of that move was fear of risk aversion – which obviated the attraction of carry trades. And as prices begin to pull back, and the risk of principal losses rises – the entire attraction of the carry is eliminated as the prospect of small swap or rollover payments is more than offset by the possibility of larger principal losses.
This is why, in 2015, USD/JPY was sliding down the elevator after spending years slow-walking up the stairs.
USD/JPY Weekly Chart 2012-2016

Chart prepared by James Stanley; USD/JPY on Tradingview
The Carry Trade Giveth – Carry Unwind Taketh Away
The beautiful part about the carry trade, when it’s working, it’s the symbiotic nature of it all. If higher rates are drawing in more buyers, well that’s demand. And that increased demand pushes prices-higher. So, the trader can not only accrue the carry from the rate differential in the pair, but there’s also the potential for principal gains driven by the fact that others may do the same, thereby continuing to increase demand.
This is why those trends in the Yen were so widely-followed in Q2: As US rates were moving higher, so was the attractiveness of carry trades being funded by the JPY, particularly in USD/JPY where the US Dollar was gaining ground, and that led to more top-side movement. This is why my Top Trade in Q4 of last year was for GBP/JPY – looking for rate differentials to kick-start the carry trade.

It’s beautiful when it works. But, it doesn’t always work.
Just as consistently as the trend can grind-higher when rates are improving, the door can be slammed when matters reverse. Because the longer that the trend continues, the more crowded the trade gets – and the more vulnerable it can become to adverse events. Eventually, once we get to a point of resistance where drawing in fresh buyers is a challenge, the exit door is only so wide and that can lead to precipitous declines.
This is why Yen trends were in reverse from mid-July and quickly came back in early-August. As US rates were falling the attractiveness of carry was diminishing, thereby motivating some traders to go the other way. The USD/JPY pullback from the July 14th high to the August low ran for 900 pips.
USD/JPY Daily Chart

Chart prepared by James Stanley; USD/JPY on Tradingview
USD/JPY
Of Yen pairs in this article, this is the least clean to me. The drive of USD-strength remains on display here but there’s some subtle yet important deviation from the DXY chart. USD went up to challenge it’s 19-year-high earlier this morning. USD/JPY, notably, remained at a lower-high that was more than 150 pips off of the July high. This is an early deduction but it does highlight how the motivation in that USD/JPY bullish trend isn’t quite what it used to be.
Nonetheless, I have this in a bullish spot at the moment, largely taken from the recent breakout of the ascending triangle. Higher-low support potential exists at prior resistance, taken from around the 135-135.57 zone.
USD/JPY Eight-Hour Price Chart

Chart prepared by James Stanley; USD/JPY on Tradingview
EUR/JPY
It seems that everywhere I look I hear about Euro weakness.
Well, it hasn’t been all that weak against the Yen!
EUR/JPY remains in consolidation. This is a symmetrical triangle but it’s far from even, as the higher-lows haven’t exactly kept pace with the lower-highs. This would lead me to track this with more of a bearish bias and perhaps even closer to a descending triangle but, realistically, that’s probably my fundamental leaning on the matter creeping in.
Big picture, support at prior resistance, around 133.50 remains notable. A breach of that leads to fresh multi-month lows. Shorter-term, a Fibonacci retracement drawn on the drawdown move, from the July high to the August low, offers some levels of relevance. The 38.2% retracement of that move continues to hold resistance, as it has for much of the past week, and this keeps the door open for short-term bearish biases.
On the support side, price is currently testing the 23.6 retracement, and the 14.4% retracement below offers up next support potential around the 135.00 psychological level.
EUR/JPY Daily Price Chart
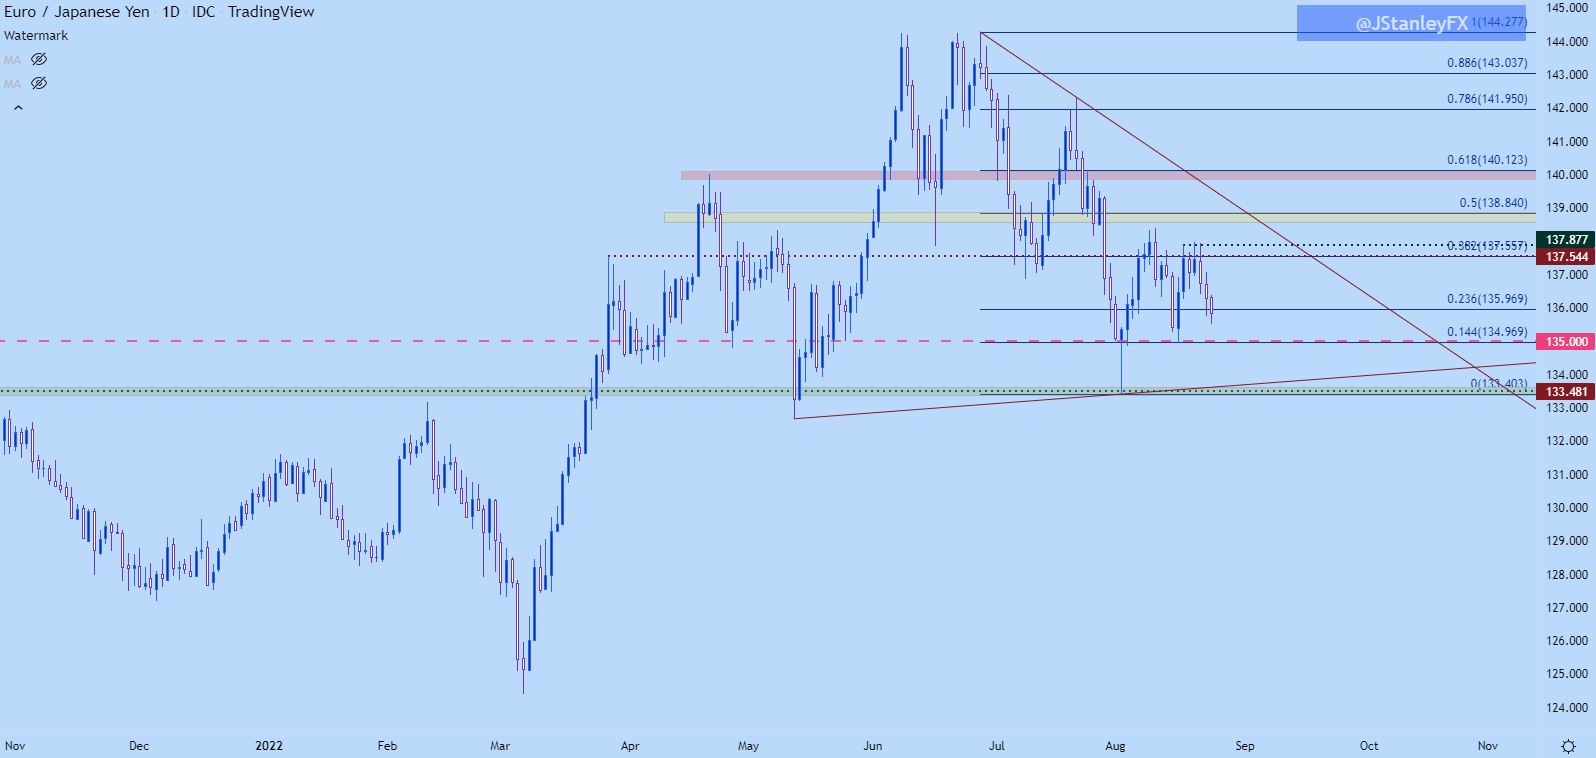
Chart prepared by James Stanley; EUR/JPY on Tradingview
GBP/JPY
Now this is a symmetrical triangle.
There’s fairly even trajectory on either side and this truly shows consolidation. It’s been brewing for about four months and there’s a massive range in here of more than 1300 pips from peak-to-trough.
I prefer the weekly chart here because it highlights how both sides of the matter have been bristling for a break. Given the prior bullish trend, one could even consider this as a longer-term bull pennant, giving some form of bias to this otherwise muted formation of compression.
On GBP/JPY, I’m tracking support in a zone running from a Fibonacci level at 159.46 up to the psychological level of 160.00. And resistance is at the 61.8% Fibonacci retracement of the 2015-2016 major move (discussed at the beginning of this article). A break of that resistance level opens the door for a strong topside continuation move, if it happens.
GBP/JPY Weekly Price Chart

Chart prepared by James Stanley; GBP/JPY on Tradingview
AUD/JPY
While AUD/JPY is showing similar consolidation as EUR/JPY and GBP/JPY above, there’s a noticeable difference. While EUR/JPY has had a slightly bearish tint towards consolidation and GBP/JPY remains middle-of-the-road, AUD/JPY actually has somewhat of a bullish quality.
A similar symmetrical triangle shows here, but price is currently testing the resistance side of that formation. That’s also confluent with the 95.00 psychological level.
AUD/JPY Weekly Chart

Chart prepared by James Stanley; AUD/JPY on Tradingview
On a shorter-term basis, we can see some additional context. A break of 95.00 opens the door for a run up to a prior double top at 95.76. At that point, short-term strategies can look for a pullback to support at prior resistance, which could keep the door open for continuation. For next resistance after that, there’s a zone running from around 96.80 up to 97.30.
AUD/JPY Daily Chart
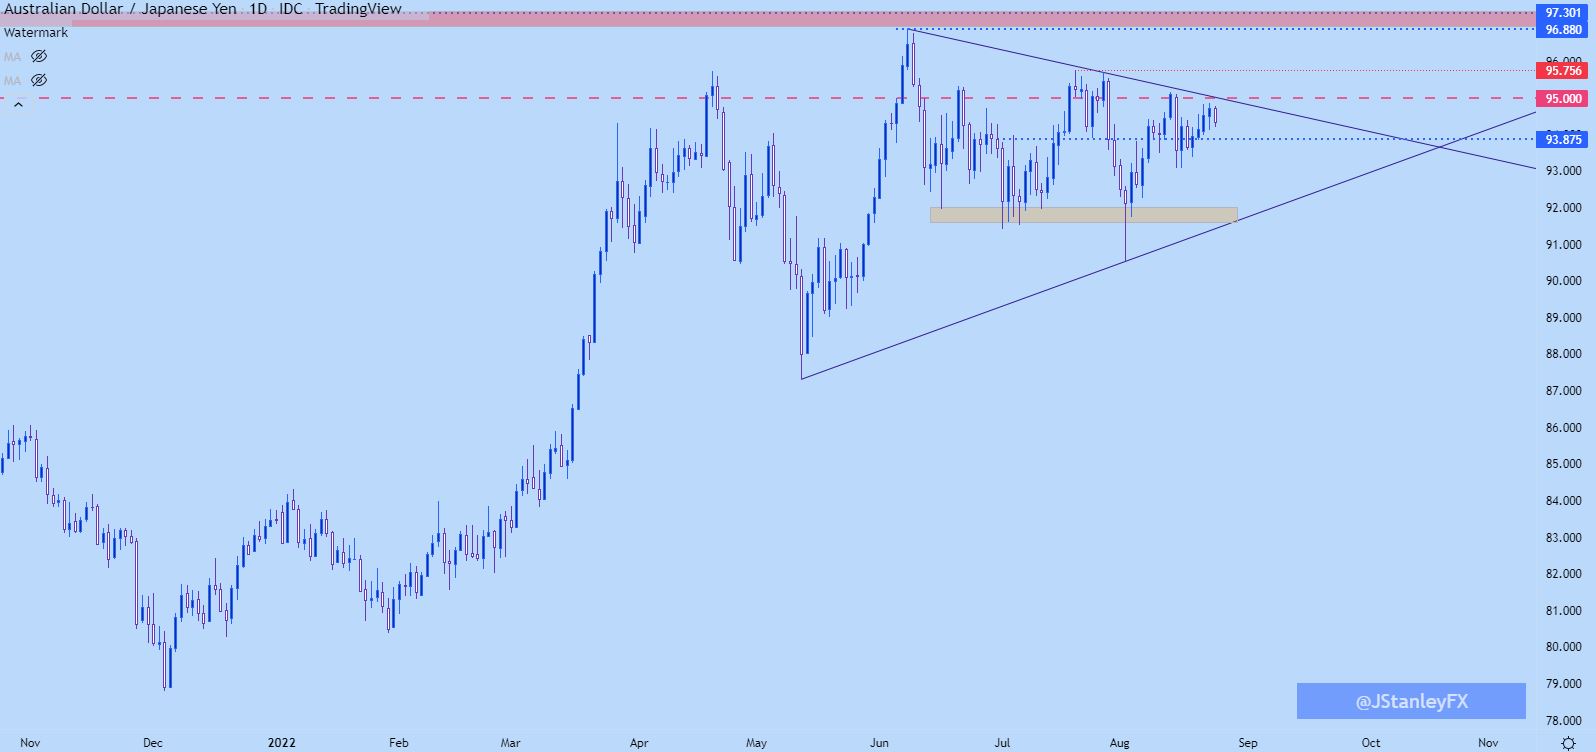
Chart prepared by James Stanley; AUD/JPY on Tradingview
--- Written by James Stanley, Senior Strategist, DailyFX.com & Head of DailyFX Education
Contact and follow James on Twitter: @JStanleyFX


