


USD/NOK TRADING STRATEGY: BULLISH
- USD/NOK reached key resistance range: 8.7881-8.8244
- Dominant uptrend to continue – small pullback ahead?
- March 7 boost likely caused by pessimistic ECB outlook
See our free guide to learn how to use economic news in your trading strategy !
USD/NOK recently entered into a key resistance range between 8.78810-8.8244, opening the door for possible upward gains not seen since the end of 2015. The over-one percent boost on March 7 appears to be the result of the ECB’s gloomy outlook for growth and inflation for 2019-2020.
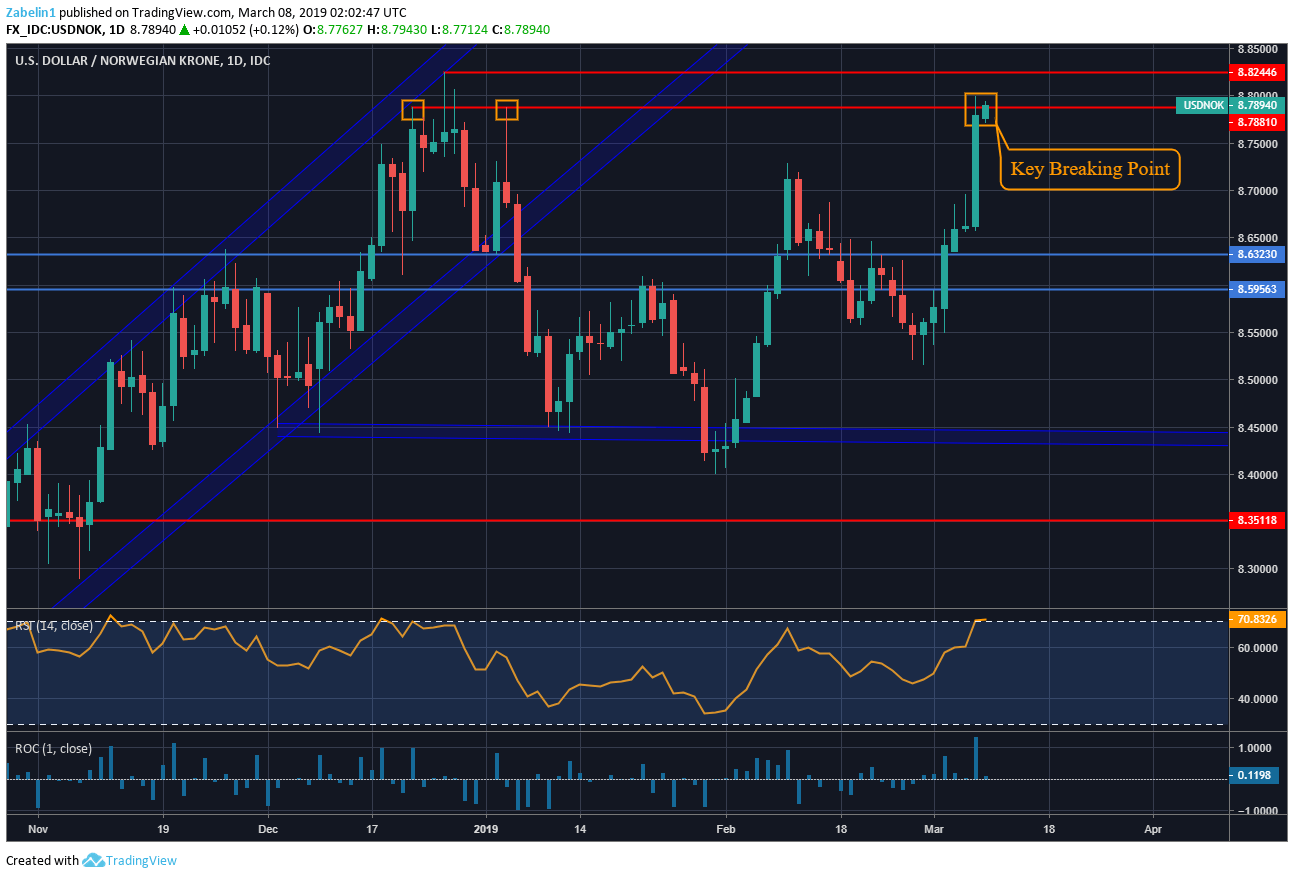
USD/NOK – Daily Chart

After skyrocketing into the new range, the pair may cool down and retreat from what appears to be an outsized gain. Negative RSI divergence is signaling the pair may have a brief pullback as upside momentum gradually cools. If the lower bound of the 8.7810-8.8244 range is tested and holds with a daily close above, it could signal a strong bullish bias in the pair.
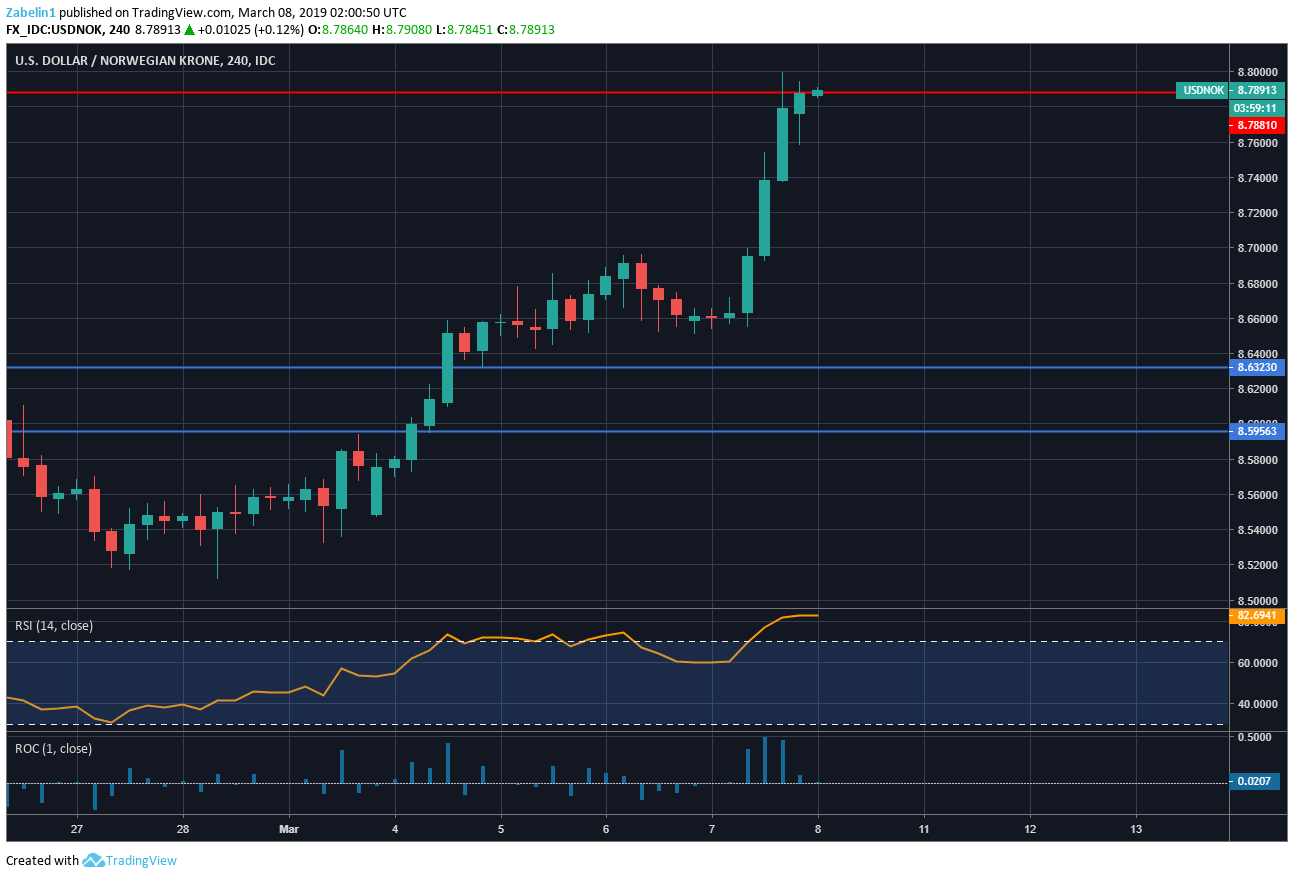
USD/NOK – 30-Minute Chart

USD/NOK may find additional resolve if Norway’s GDP release tomorrow falls short of the 0.3 percent forecast. The four-hour chart shows the pair just on the edge of the lower bound of resistance. Having a daily close above this point would break a significant psychological barrier that kept the pair at bay in December and early January.
USD/NOK – Four-Hour Chart
USD/NOK – Daily Chart
USD/NOK TRADING RESOURCES
- Join a free Q&A webinar and have your trading questions answered
- Just getting started? See our beginners’ guide for FX traders
- Having trouble with your strategy? Here’s the #1 mistake that traders make
--- Written by Dimitri Zabelin, Jr Currency Analyst for DailyFX.com
To contact Dimitri, use the comments section below or @ZabelinDimitri on Twitter


