


NZD/USD extends the series of lower highs and lows from earlier this week as New Zealand Employment unexpectedly hold flat in the second quarter of 2022, and the exchange rate may face a further decline as it appears to be tracking the negative slope in the 50-Day SMA (0.6294).
Keep in mind, NZD/USD briefly traded above the moving average on the back of US Dollar weakness, but the advance from the yearly low (0.6325) may turn out to be a correction in the broader trend as the exchange rate struggles to hold above the indicator.
NZD/USD Rate Daily Chart
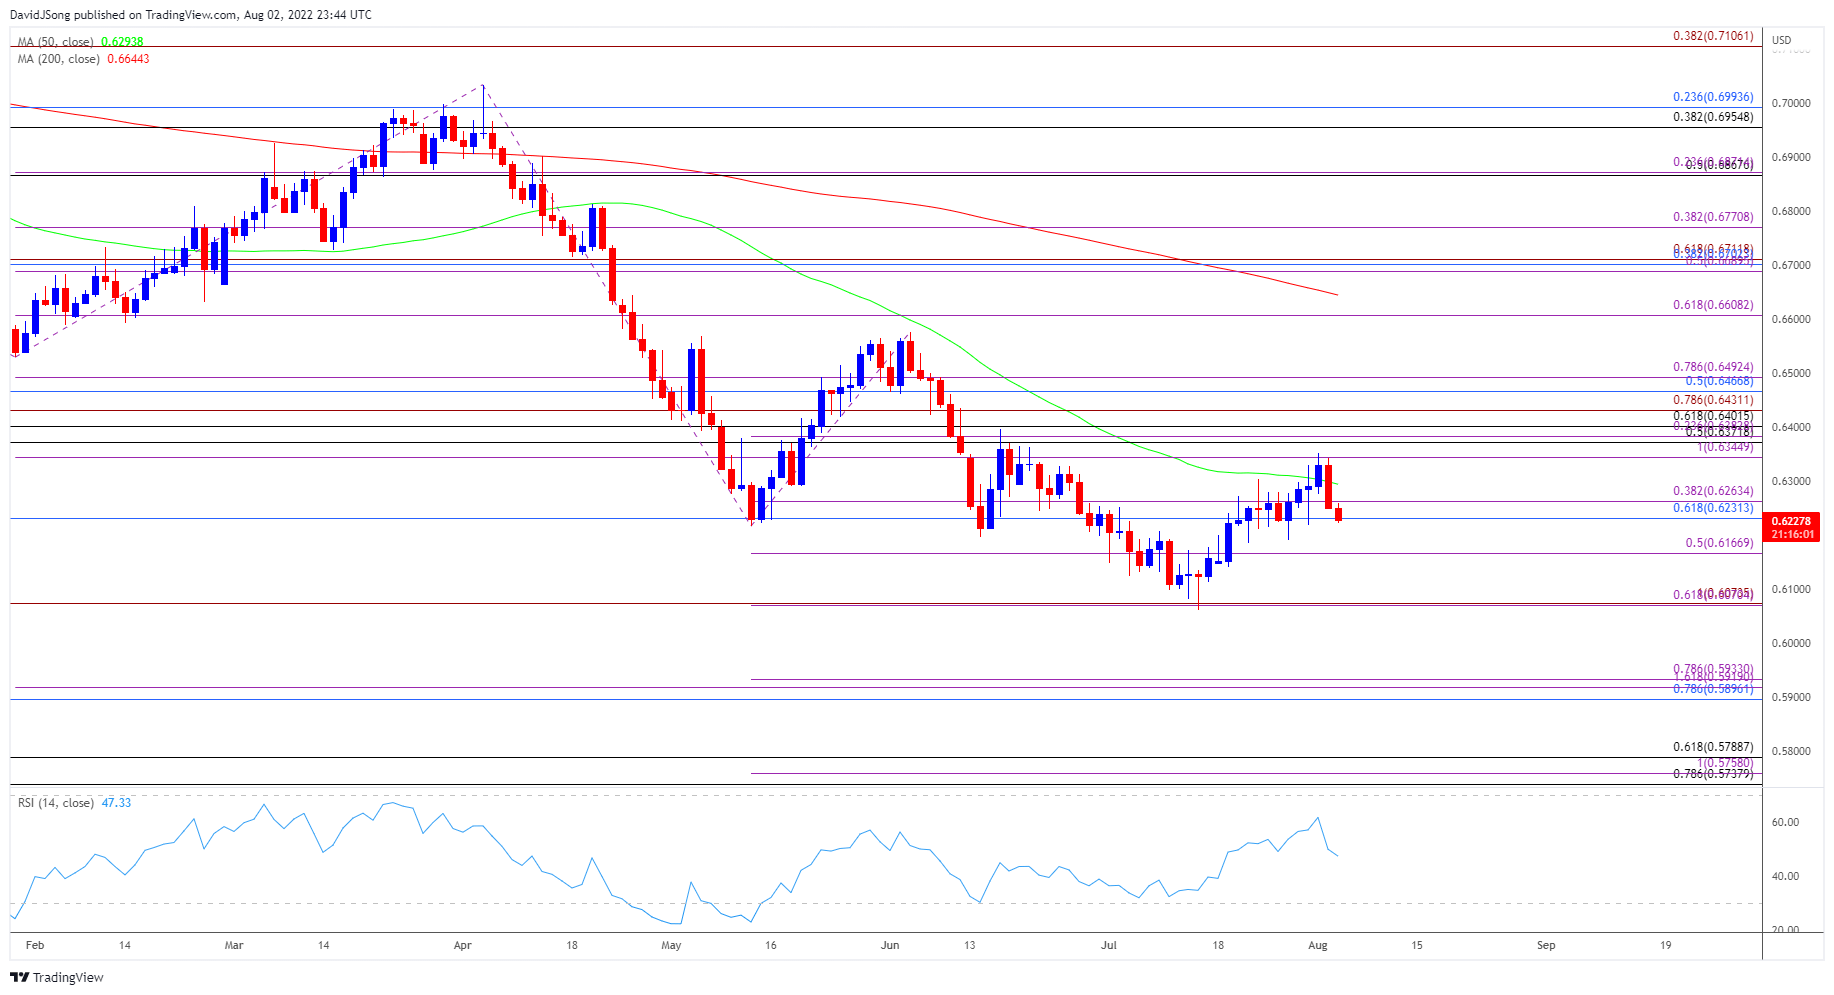
Source: Trading View
The opening range for August raises the scope for a further decline in NZD/USD as it carves a series of lower highs and lows, with the failed attempt to close above 0.6350 (100% expansion) pushing the exchange rate back below the 0.6230 (61.8% retracement) to 0.6260 (38.2% expansion) region.
Next area of interest comes in around 0.6170 (50% expansion) followed by the 0.6070 (61.8% expansion) region, with a break of the yearly low (0.6325) opening up the Fibonacci overlap around 0.5900 (78.6% retracement) to 0,5930 (78.6% expansion).

--- Written by David Song, Currency Strategist
Follow me on Twitter at @DavidJSong


