


NZD/USD is on track for a three-week rally as it extends the advance following the Reserve Bank of New Zealand (RBNZ) interest rate decision, with the exchange rate approaching the May high (0.6558) as it snaps the series of lower highs and lows from the start of the week.
In turn, NZD/USD may attempt to test the 50-Day SMA (0.6599) for the first time since April on the back of US Dollar weakness, but lack of momentum to test the indicator may cast a bearish outlook for the exchange rate as the moving average reflects a negative slope.
NZD/USD Rate Daily Chart
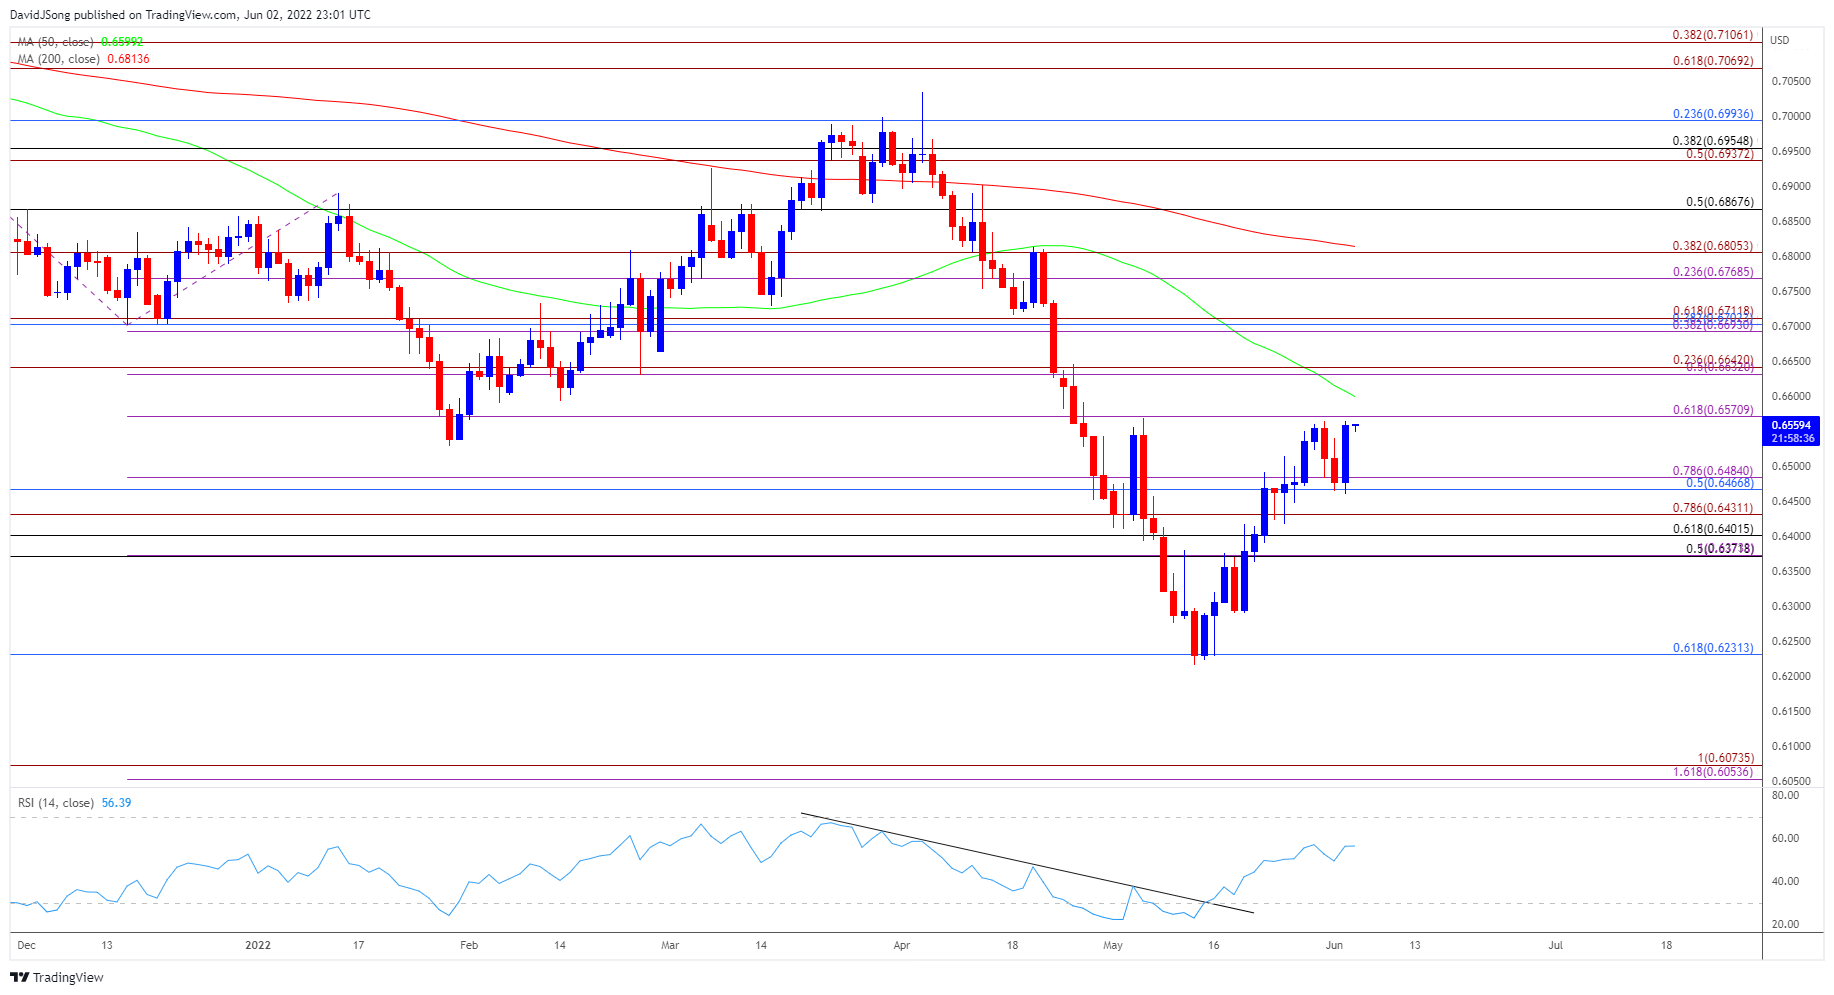
Source: Trading View
Keep in mind, NZD/USD reversed course ahead of the June 2020 low (0.6185)as it struggled to close below the 0.6230 (61.8% retracement) region, with the advance from the May low (0.6216) pulling the Relative Strength Index (RSI) out of oversold territory.
NZD/USD is on the cusp of testing the May high (0.6558) as it manages to hold above the 0.6470 (50% retracement) to 0.6480 (78.6% expansion) region, with a break/close above the 0.6570 (61.8% expansion) area bringing the 50-Day SMA (0.6599) on the radar.
A move above the moving average may push NZD/USD towards the 0.6630 (50% expansion) to 0.6640 (23.6% expansion) region, with the next area of interest coming in around 0.6690 (38.2% expansion) to 0.6710 (61.8% expansion).
However, NZD/USD may ultimately track the negative slope in the moving average if it fails to clear the May high (0.6558), with a break/close below the 0.6470 (50% retracement) to 0.6480 (78.6% expansion) region opening up the Fibonacci overlap around 0.6370 (50% retracement) to 0.6430 (78.6% expansion).

--- Written by David Song, Currency Strategist
Follow me on Twitter at @DavidJSong


