


Japanese Yen, USD/JPY, US CPI, Ukraine, Fed, Technical Analysis – Analyst Pick
- Japanese Yen may remain at risk to US Dollar despite Ukraine tensions
- US inflation may continue surprising higher, keeping the Fed on the edge
- USD/JPY faces an Ascending Triangle chart formation, watch for breakout

USD/JPY Maintains its Footing Despite Russia’s Attack on Ukraine, What’s Next?
All things considered, the Japanese Yen has not been holding up relatively well against the US Dollar since Russia commenced its attack on Ukraine. Sure, you will find corners of the forex market where the anti-risk JPY absolutely crushed its major peers. These primarily include the Euro and British Pound. Meanwhile, the sentiment-linked Australian and New Zealand Dollars soared against JPY.
EUR and GBP, which soared as tensions in Ukraine cooled in recent days, still remain vulnerable to escalation risk. AUD and NZD have been gaining despite their sensitivity to deteriorating risk appetite, likely due to rising commodity prices. In my eyes, this leaves Yen crosses like EUR/JPY, GBP/JPY, AUD/JPY and NZD/JPY vulnerable to heightened volatility. USD/JPY could be a better defensive play.
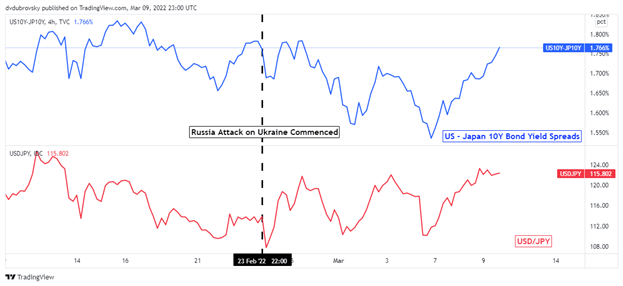
On the 4-hour chart below, USD/JPY can be closely seen following the spread between United States and Japanese 10-year government bond yields. Both currencies tend to take on a ‘haven’ role in forex markets. As Russia invaded Ukraine, traders flocked to both fiat units. What gave, and still likely does, the Greenback an edge over the Yen is a hawkish Federal Reserve.
Unfortunately for the central bank, the crisis in Ukraine is propping up commodity prices, especially oil, acting as a supply shock. This will likely boost inflation in the near-term, leaving the Federal Reserve in a tough spot. On Thursday, headline US CPI is expected to clock in at 7.9% y/y for February, up from 7.5% prior. A few firms are also predicting prices to rise 8%.
Despite tensions in Ukraine, the Fed is all set to raise benchmark lending rates next week, with quantitative tightening to likely follow soon. High inflation in the near-term may thus continue to favor the US Dollar relative to the Japanese Yen, especially if front-end Treasury yields remain elevated. The 2-year rate just closed at its highest since late 2019, clocking in at 1.66%.

USD/JPY Versus US-Japan 10-Year Government Bond Yield Spreads
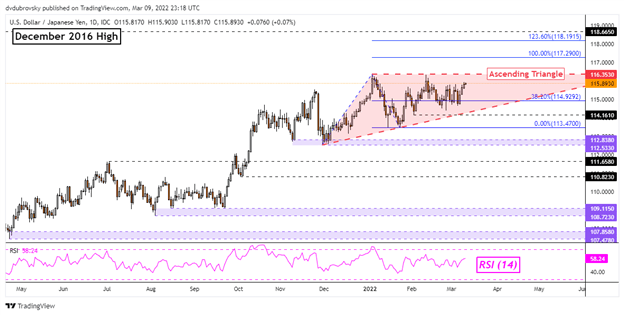
USD/JPY Technical Analysis Daily Chart
On the daily chart, USD/JPY appears to be trading within the boundaries of an Ascending Triangle chart formation. The pair is approaching the ceiling of the triangle, which sits around 116.35. A breakout to the upside may open the door to uptrend resumption, exposing the 100% and 123.6% Fibonacci extensions at 117.29 and 118.19 respectively. Then the December 2016 peak at 118.66 will kick in.
In the event prices turn lower, the floor of the triangle, which is a rising trendline, may maintain an upside focus. Still, a breakout under the triangle could have bearish consequences. Such an outcome would place the focus on the current 2022 low at 113.47 before the 112.53 – 112.83 support zone kicks in.
Trade Smarter - Sign up for the DailyFX Newsletter
Receive timely and compelling market commentary from the DailyFX team
--- Written by Daniel Dubrovsky, Strategist for DailyFX.com
To contact Daniel, use the comments section below or @ddubrovskyFX on Twitter


