


Talking Points
- Directional move looming in USD/CAD
- 1.2360 and 1.2525 levels look critical
Unfamiliar with Gann Square Root Relationships? Learn more about them HERE.
USD/CAD has spent the month of February in sideways to lower range. Bears would say the exchange rate has consecutive lower highs while bulls would probably call it a “pennant pattern”. We really just see it as a sharp contraction in volatility. Given the mean reverting nature of volatility this should mean that a sharp directional move in USD/CAD is not far off. The real question is in which direction?
There are a couple of ways to look at it. The failed push at the start of the week above the trendline connecting the year’s high and the mid-February high could be interpreted as a false pattern breakout. Some of the best directional moves in foreign exchange stem from failed pattern breakouts. The logic is simple. A good portion of the market gets trapped on a technical break in one direction and is then forced to stop out as the pattern fails to materialize resulting in momentum going in the other direction. Is that what is going on here? It very well could be, but it would take a move under the mid-February lows around 1.2360 to confirm this thinking and set the stage for a more serious decline. The fact is that as long as 1.2360 holds there is a very strong possibility that USD/CAD is still in the midst of the bullish ‘pennant’. Traditional technical thinking suggests that triangle formations should play out in at least five legs. The last leg was missing earlier in the week, but if the exchange rate can hold 1.2360 and gain traction over 1.2525 the technical outlook will turn quite favorable.
To receive other reports from this author via e-mail, sign up to Kristian’s e-mail distribution list via this link.
USD/CAD Daily Chart: February 27, 2015
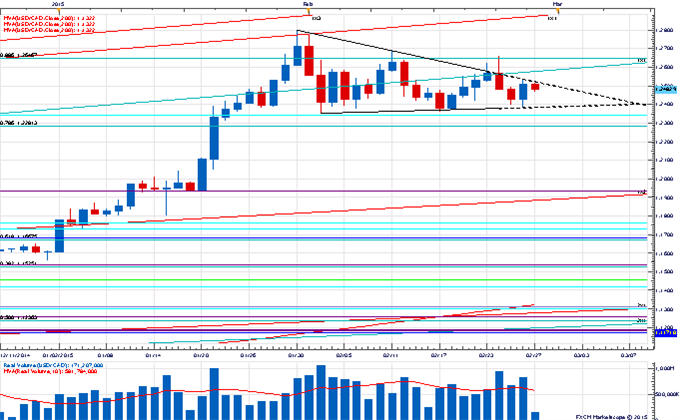
Charts Created using Marketscope – Prepared by Kristian Kerr
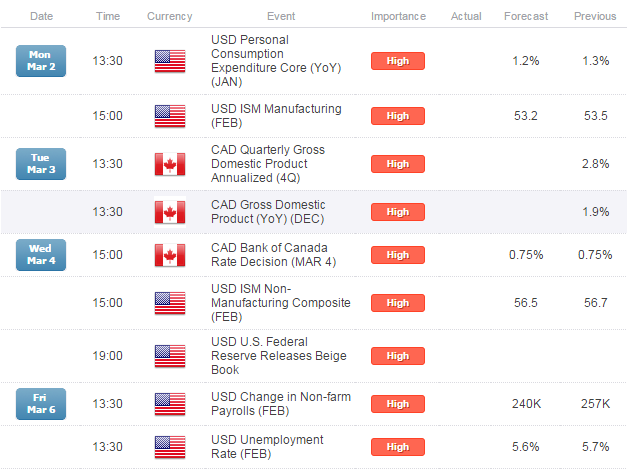
Key Event Risk in the Week Ahead:
LEVELS TO WATCH
Resistance: 1.2525 (internal trendline), 1.2625 (MTD high close)
Support: 1.2360 (mid-February low), 1.2320 (Fibonacci)
Strategy: Buy USD/CAD
Entry: Buy USD/CAD if it closes above 1.2525 within the next couple of trading days
Stop: Daily close below 1.2435
Target: 1.2715
--- Written by Kristian Kerr, Senior Currency Strategist for DailyFX.com
To contact Kristian, e-mail instructor@dailyfx.com. Follow me on Twitter at@KKerrFX.


