


Market value ratios can be a great way to enhance stock research by using mathematical formulas for publicly traded companies. Stock traders use these financial metrics to analyse stocks and provide potential investment ideas. This article will give more colour to market value ratios and how they can be used to implement investment strategies.
What are market value ratios?
Market value ratios are formulas that are used to provide insights into a company’s share price. There are many formulas that are used in various combinations for different analytical techniques. One thing is for sure, market value ratios give equity analysts a basic framework of a company and can possibly help to identify undervalued or overvalued stocks.
5 significant market value ratios to understand
Different ratios provide different types of feedback to the investor. Relying on one specific ratio is never wise as a single data point may only give one perspective while other ratios could obviate this singular view with an opposing indication. That is, a broader outlook (multiple ratios) give rise to more informed investment decisions. Below is a list of important market value ratios to keep in mind when analysing stocks:
- P/E Ratio
- Dividend Yield Ratio
- Market Capitalization
- Book Value Per Share
- Price-to-Book Ratio
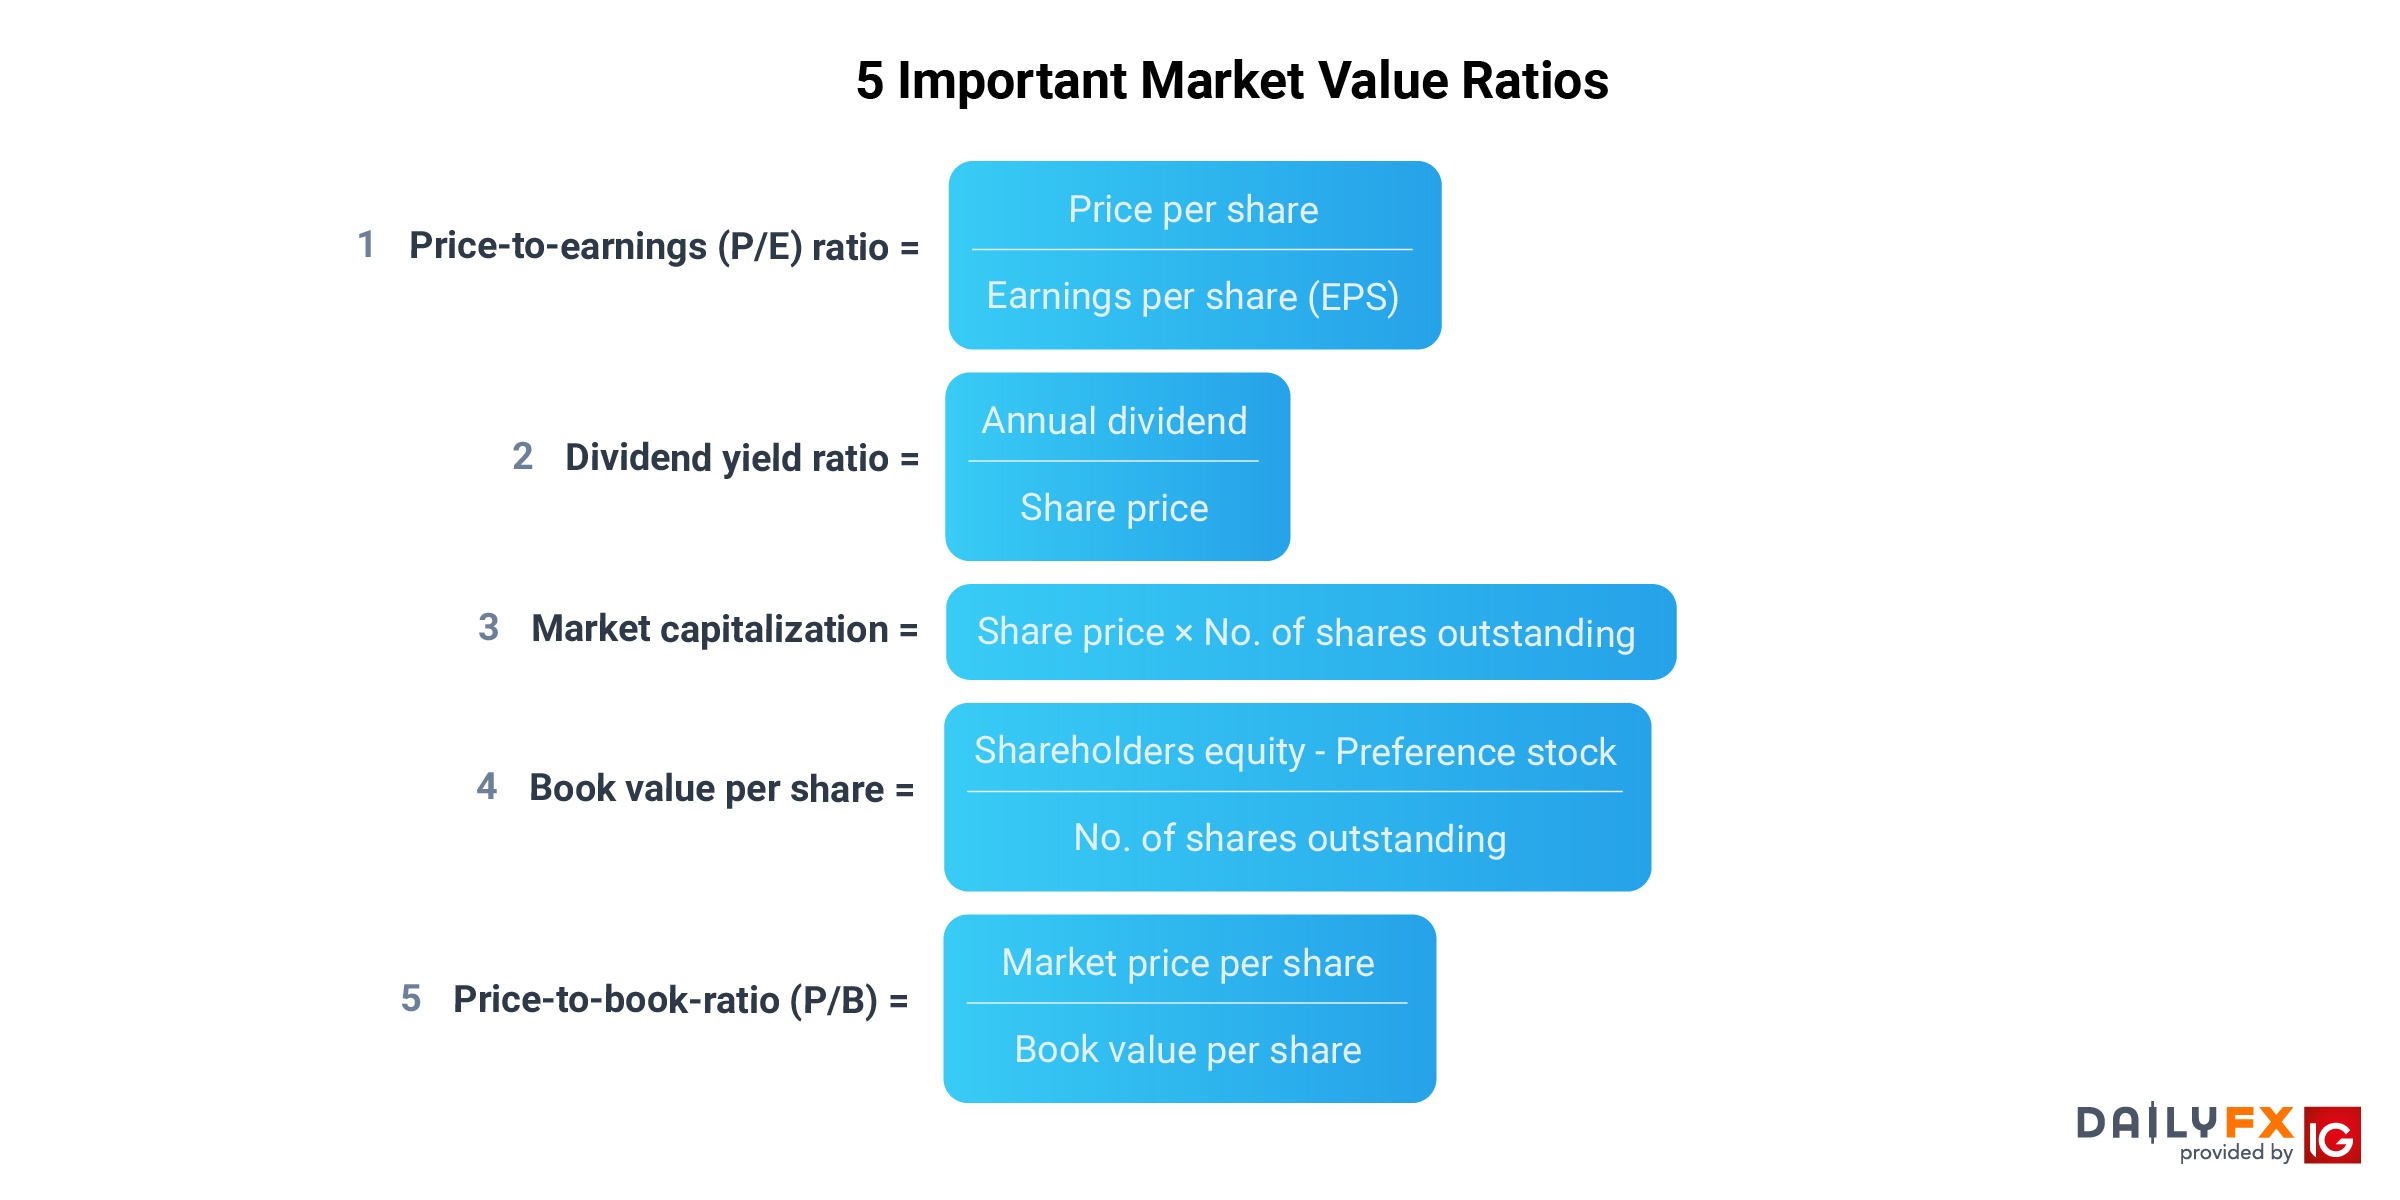
1. Price-to-earnings (P/E) ratio = Price per share/Earnings per share (EPS)
The P/E ratio also knows as the price/earnings multiple is one of the most popular ratios used by investors to determine the value of a share. This ratio measures the current share price against the earnings per share (EPS). The P/E ratio simply indicates the amount an investor would pay for $1 of a company’s earnings.
Different industries or stock sectors can have varying P/E averages/ranges at which they trade. For example, the property sector may have a P/E ratio of 20, while financial services may only have an average P/E ratio of 12. This is important to factor in when valuing a stock.
A high P/E ratio could imply that the stock is more richly valued because investors are paying a higher price for each dollar of the company’s earnings. This may also display investor confidence in that the higher price reflects expected increases in future earnings, or growth potential.
A low P/E ratio may show investors that the price of the stock is relatively low compared to earnings, suggesting the stock may be undervalued. Alternatively, this can also mean low consumer confidence in terms of future growth, or potential headwinds that the company may have to face down-the-road.
Limitations of the P/E ratio
The ratio overlooks a company’s EPS growth projections. Stocks with high P/E ratios can still be attractive ‘buy’ options for investors as future EPS growth will ultimately bring the P/E ratio down. In addition to this, company debt is not directly factored either which may have a significant financial impact on a company.
2. Dividend yield ratio = Annual dividend/Share price
The dividend yield ratio helps investors understand the return on investment. This ratio shows the proportion of dividends that a company pays out in comparison to the market price of its stock.
It is important to note that many companies do not pay dividends which excludes this ratio. Younger companies will often reinvest profits back into the business rather than paying dividends in the effort of achieving stronger potential growth rates; while older, more mature companies may be more open to returning a portion of their net profits to shareholders.
A high or low yield can be interpreted depending on the company and relative industry. Mature companies may not have the same growth potential as a younger, fast growing company. So, in turn, some mature companies may display higher yields as opposed to lower yields from younger companies.
To conclude, the dividend yield ratio does not necessarily have a direct impact on stock valuations, but rather shows investors how much of a company’s net profits have been returned to shareholders, thereby allowing investors to choose stocks that may align to their investment needs.

Limitations of the dividend yield ratio
Dividend yield figures may be misinterpreted. For example, high yields may present themselves due to a falling share price as opposed to increased dividends. Also note – dividends are not guaranteed, and companies may cut their dividends in the future, particularly if company or industry performance suffers. This can lead many investors that are ‘chasing’ yield in a difficult space if the company later announces a reduction or altogether skipping of future dividend payments.
3. Market capitalization = Share price × no. of shares outstanding
This figure represents the size of the company. Large cap stocks are companies with values of more than $5 billion, while mid cap companies have market capitalization of between $1 and $5 billion. Small cap companies carry market caps of less than $1 billion; and this is a very key component of segmentation in equity markets.
It’s important to note that share price itself is not necessarily indicative of company size. If XYZ corporation had a $50 share price but a $2 billion valuation, it would be smaller than ABC corporation with a $20 share price and a $10 billion valuation. ABC would fit the description of large cap, while XYZ would be considered a mid-cap stock.
Limitations of market capitalization
This merely looks at the value of the stock at that particular moment in time, and has little leading quality. It can, however, enable an investor to structure their portfolio more efficiently in the effort of meeting their goals; enabling a focus on either larger, more developed companies or smaller companies that may carry greater growth potential.
4. Book value per share = (Shareholders equity - Preference stock)/No. shares outstanding
The book value per share represents the value of equity that remains after deducting debts and assuming that the company's assets were liquidated. The book value per share is a measure that is not forward looking in its mathematical makeup. If a company is trading below its book value, that may be a sign that something else is going on or that investors are cautious of potential risks ahead that may adversely affect the company; thus, this measure is a possible indicator of the health of a company and how optimistic investors may be about future growth potential.
Limitations of the book value per share
Based on the book value of a company which excludes intangible assets into the equation. Comparing market value per share and book value per share can be flawed because of the composition of the formulas and the potential disconnect of ignoring growth potential.
5. Price-to-book-ratio (P/B) = Market value/Book value
This P/B ratio is used to find how a company is valued by comparing its market value to the book value. If the ratio is greater than one, the stock is trading at a premium to book value; if it is less than one, the stock price is trading below the book value.
A ratio greater than one suggests that the stock price of a company is trading at value more than the worth of its equity. This could signal to investors that the company has promising profit forecasts and that investors are willing to pay a premium for this future projection. Higher expected growth rates can often bring on higher P/E or P/B ratios as investors are anticipating stronger growth ahead.
A price-to-book ratio of less than one indicates that investors are unwilling to pay even the book value of a company. A lower ratio can highlight investor fear or pessimism of what might be ahead for that particular company.
Limitations of the P/B ratio
The P/B ratio ignores the intangible assets of a company which in the modern era is a large component of many stock valuation techniques.
Market value ratios FAQs
Why are market value ratios important?
These ratios are important because they give insight into different aspects of a company which is why investors do not usually rely on only one ratio. Market value ratios are like pieces of a puzzle. These pieces need to be individually analysed to compile an overall picture for informed investment decisions. When comparing stocks in the same industry, investors often see the same/similar ratio figures. However, if an investor takes the time to investigate further valuation ratios, this may lead to differences which can provide investment opportunities.
Further reading on stock research and valuation
- Read our guide to picking the best stocks
- Find out how to conduct effective stock research
- Learn the differences between stock trading and investing