

AUD/JPY

AUD/JPY
Bullish
 1h
1h
Last updated:
Apr 26, 2024
| Low | |
| High |
of clients are net long.
of clients are net short.
Average True Range
Total Intraday Range (% of ATR)
Note: Low and High figures are for the trading day.
The Australian Dollar (AUD) against the Japanese Yen (JPY) is an exciting pair for its relation to risk. The pair is often among one of the most highly correlated pairs to price action in US equities on a short to medium term basis. The pair generally tends to rise in a low risk environment on carry flows while the opposite is true when we see a 'risk-off' approach in the markets.
Advertisement
News & Analysis
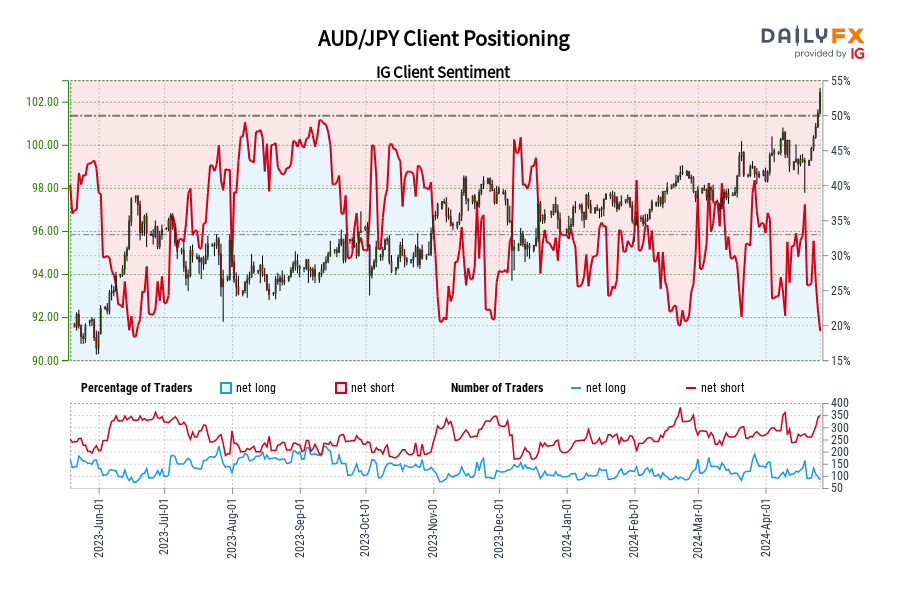
AUD/JPY IG Client Sentiment: Our data shows traders are now at their least net-long AUD/JPY since Jun 19 when AUD/JPY traded near 97.22.
2024-04-26 10:23:37

Australian Dollar Outlook – AUD/USD and AUD/JPY Technical and Sentiment Analysis
2024-04-25 19:00:26

Australian Dollar Outlook & Sentiment Analysis: AUD/USD, AUD/JPY
2024-04-11 00:00:00
Japanese Yen Sentiment Analysis and Outlook: USD/JPY, GBP/JPY, AUD/JPY
2024-04-02 17:30:00
Australian Dollar Q2 Technical Forecast: AUD/USD and AUD/JPY
2024-03-30 00:30:00
Japanese Yen Outlook - Market Sentiment Signals for EUR/JPY, GBP/JPY, AUD/JPY
2024-03-26 17:00:00
Japanese Yen Outlook: Markets Prioritise CPI Beat over Lower Trending Prices
2024-02-27 12:47:31


IG Client Sentiment
AUD/JPY
Bullish
Daily change in
Longs
-10%
Shorts
4%
OI
2%
Weekly change in
Longs
-24%
Shorts
43%
OI
25%
Advertisement
