


USD/CAD Technical Outlook
- USD/CAD breakout is sticking so far with good momentum staying in place
- With the dollar higher, stocks lower scenario looking likely to continue so will CAD weakness
- Levels and lines to watch in the days ahead

USD/CAD Technical Outlook: Continuing to Extend, Levels to Watch
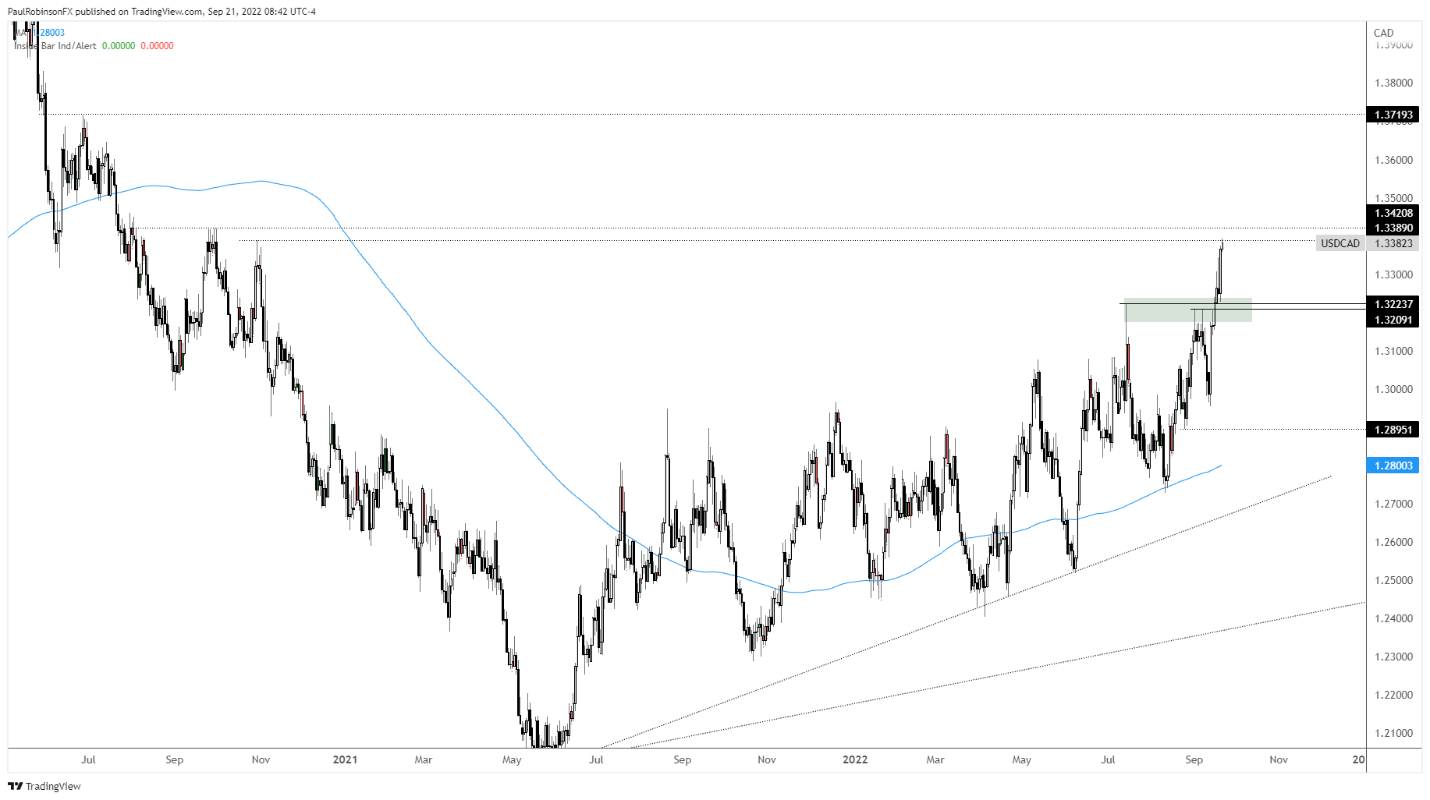
USD/CAD is finally making good on a breakout with strong momentum having been with the pair for over a week now. Breakouts often fail for this pair, but as noted last week with repeated attempts to break out of the 13207/23 area finally giving way to momentum, coupled with general risk-off, it looked like a breakout could finally stick.
To be fair, it looked like it was on the verge of failing just the other day when it put in a full reversal day, but given that the reversal only led to a test of the breakout zone it was still given the benefit of the doubt. Yesterday’s rip to new cycle highs continues the trend.
USD/CAD is getting into some levels here as swing highs from September and October 2020 come into play in the 13390/418 area. The thinking is that while they may matter in the near-term, bigger picture they won’t.
Conviction is high that stocks see a new bear market cycle low this fall, and at the same time the dollar will continue to propel higher. USD/CAD has a 21-day correlation of -0.92 to the S&P 500, so it is essentially a play on stocks.
Should we see stocks rally a bit before heading lower, watch the breakout zone in the low 13200s for support. On the top-side should we see strength persist or pick up again after a dip, the area around 13700 will be next up as a potential hurdle.

USD/CAD Daily Chart
Resources for Forex Traders
Whether you are a new or experienced trader, we have several resources available to help you; indicator for tracking trader sentiment, quarterly trading forecasts, analytical and educational webinars held daily, trading guides to help you improve trading performance, and one specifically for those who are new to forex.
---Written by Paul Robinson, Market Analyst
You can follow Paul on Twitter at @PaulRobinsonFX


