


US Dollar, USD/SGD, USD/PHP, USD/THB, USD/IDR – ASEAN Technical Analysis
- US Dollar managed to hold ground against most ASEAN currencies
- This leaves USD/SGD, USD/THB and USD/IDR facing key support
- Philippine Peso extended gains, but now USD/PHP eyes next test

Singapore Dollar Technical Outlook – Neutral
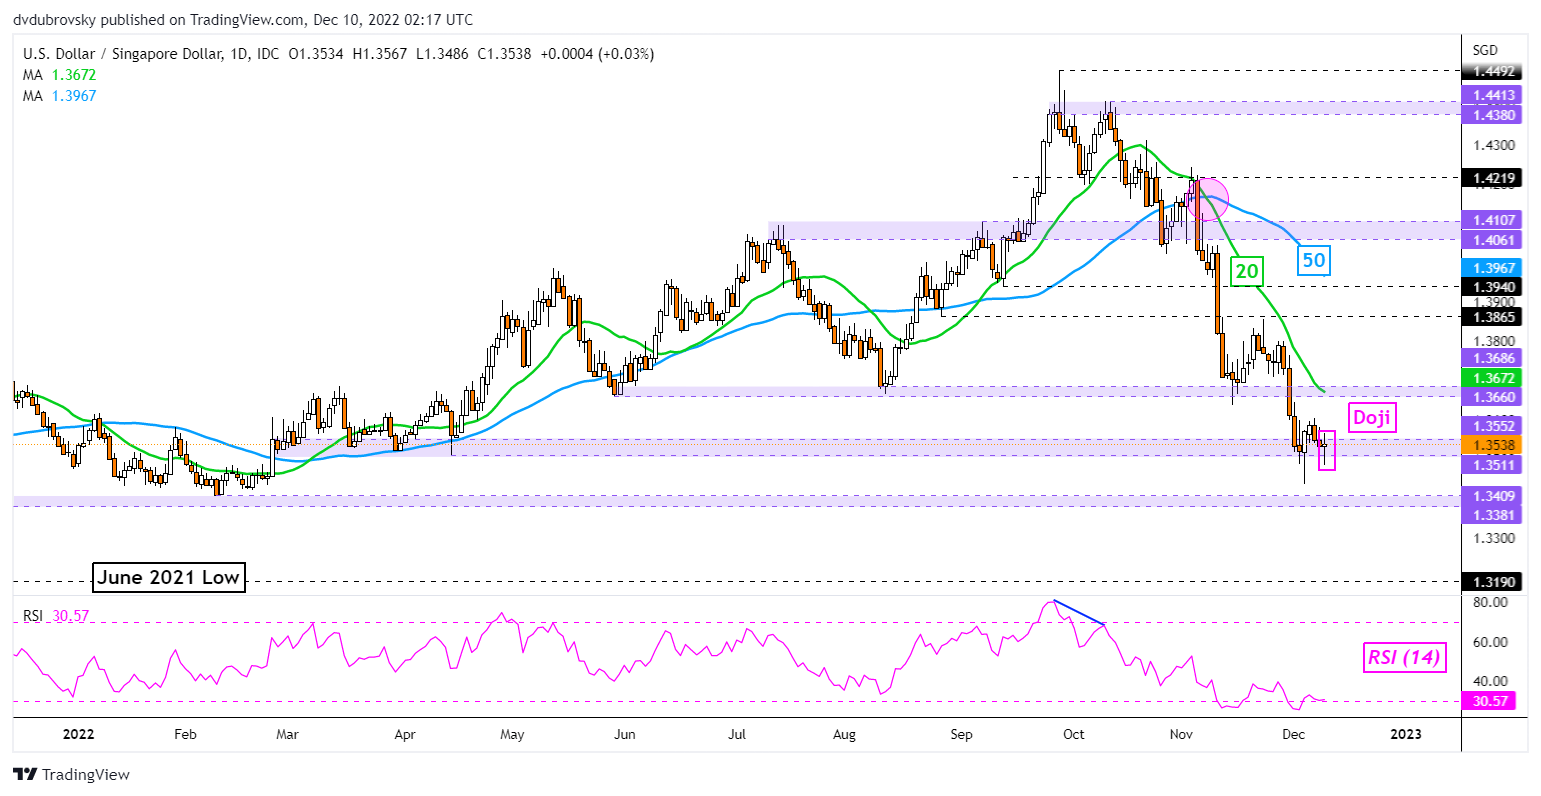
The Singapore Dollar ended flat against the US Dollar this past week, with USD/SGD unable to drop under the key 1.3511 – 1.3552 support zone from March. Prices left behind a Doji candlestick pattern, which is a sign of indecision. Still, the 20- and 50-day Simple Moving Averages (SMAs) remain titled lower, offering a downside technical bias. Clearing the former may open the door to a bullish reversal. Otherwise, extending losses exposes the 1.3381 – 1.3409 zone below.
USD/SGD Daily Chart
Philippine Peso Technical Outlook – Slightly Bullish
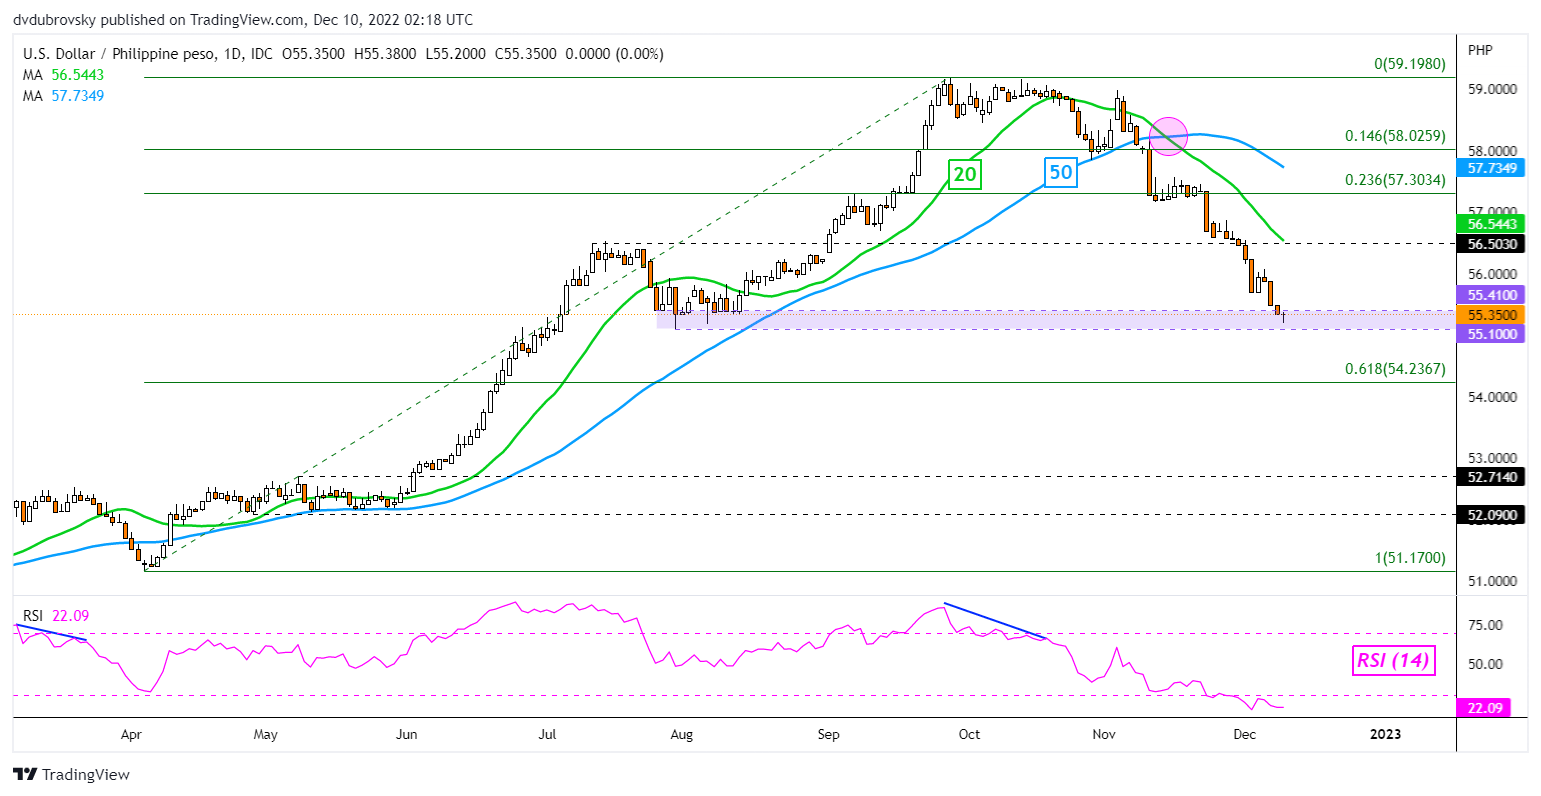
The Philippine Peso extended gains against the US Dollar this past week. While this is a clear bullish sign for the currency, USD/PHP is now testing the critical 55.10 - 55.41 support zone. The latter has its beginnings in August. If it holds, we may see prices pivot higher toward the 20-day SMA, which can reinstate the downside bias. Extending losses expose the 61.8% Fibonacci retracement level at 54.236.

USD/PHP Daily Chart
Thai Baht Technical Outlook – Neutral
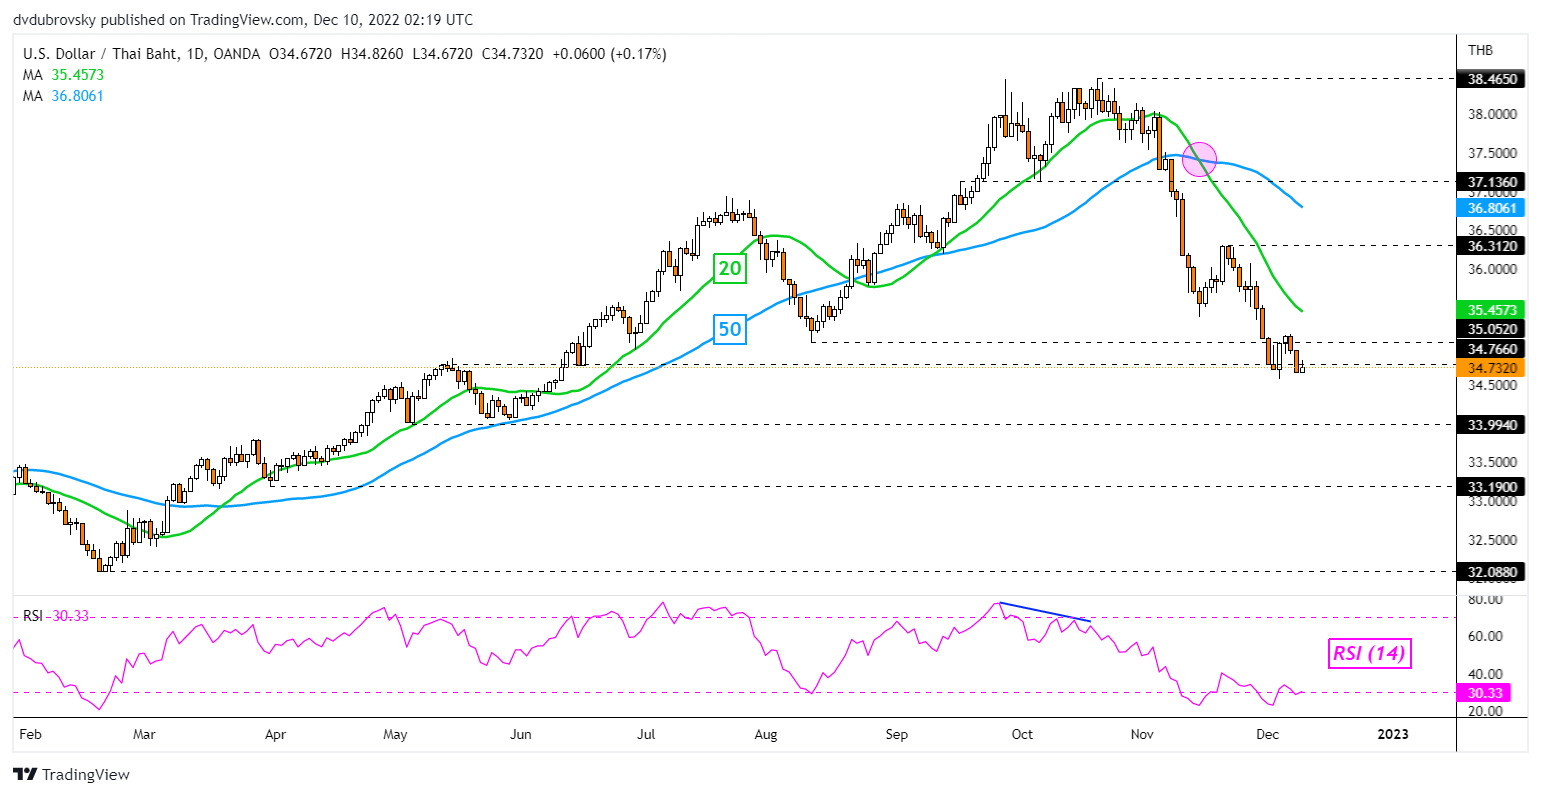
The Thai Baht was little changed against the US Dollar this past week. This leaves USD/THB facing the familiar 34.76 inflection point, which held as support. Confirming a downside breakout exposes the May low at 33.994 and downtrend resumption. On the other hand, keep a close eye on the 20-day SMA, which is maintaining the downside focus. The latter could hold as key resistance in the week ahead.
USD/THB Daily Chart
Indonesian Rupiah Technical Outlook – Neutral
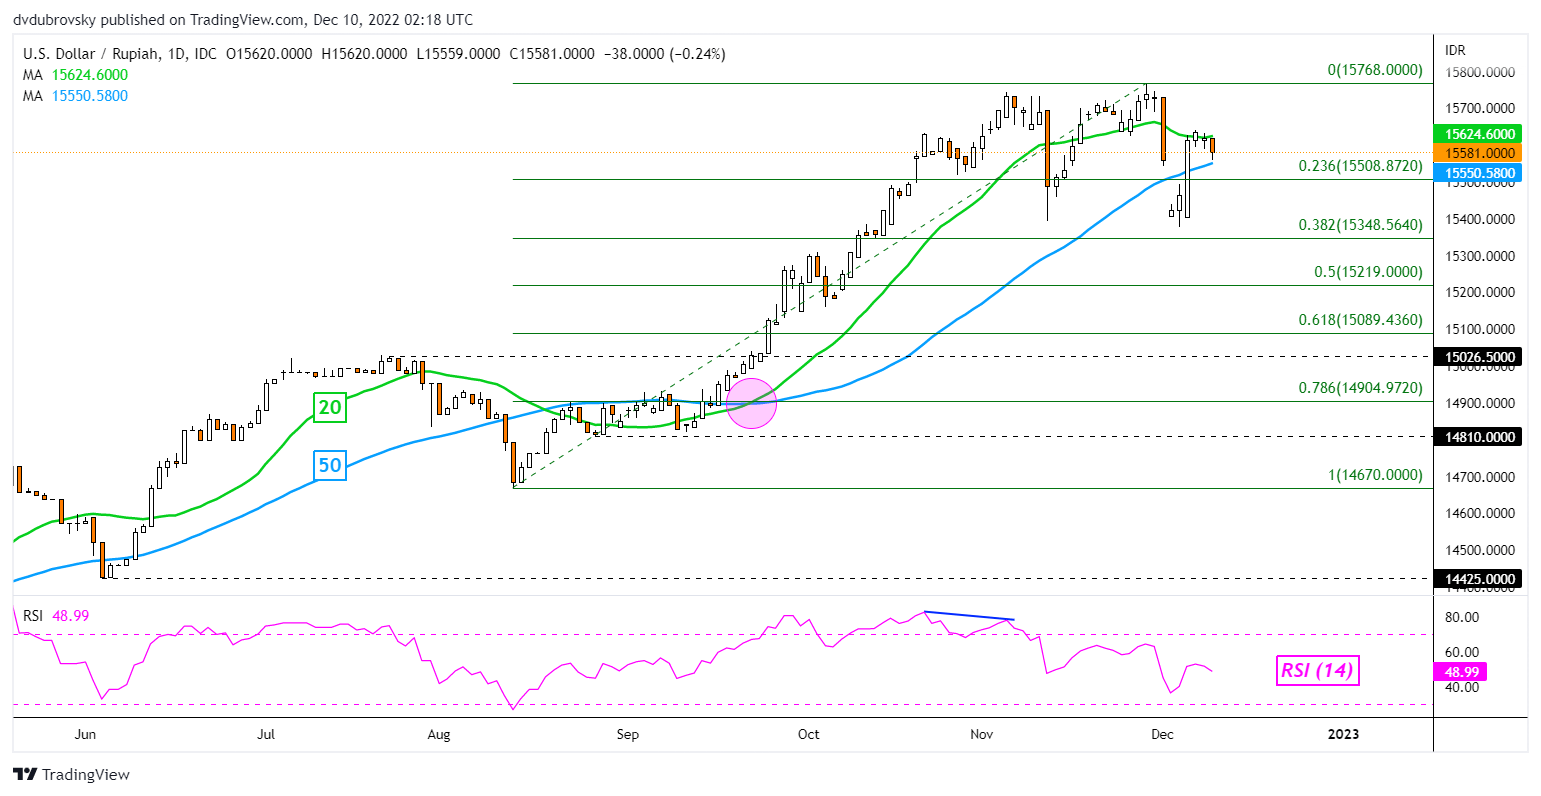
The US Dollar finished slightly higher against the Indonesian Rupiah last week, leaving USD/IDR above the 23.6% Fibonacci extension at 15508. The pair also was unable to hold a breakout under the 50-day SMA. This is leaving a neutral position for the exchange rate in the week ahead. Breaking above the 20-day SMA exposes the November high at 15768. Clearing support on the other hand exposes the 38.2% Fibonacci retracement level at 15348.
USD/IDR Daily Chart
--- Written by Daniel Dubrovsky, Senior Strategist for DailyFX.com
To contact Daniel, follow him on Twitter:@ddubrovskyFX


