


US Dollar, USD/SGD, USD/IDR, USD/PHP, USD/THB – ASEAN Technical Analysis
- US Dollar continues to lose ground, tumbling against ASEAN FX
- USD/SGD, USD/PHP drop most in a month going back to 2016
- USD/THB saw the exchange rate weaken most since 1998

Singapore Dollar Technical Outlook – Bullish
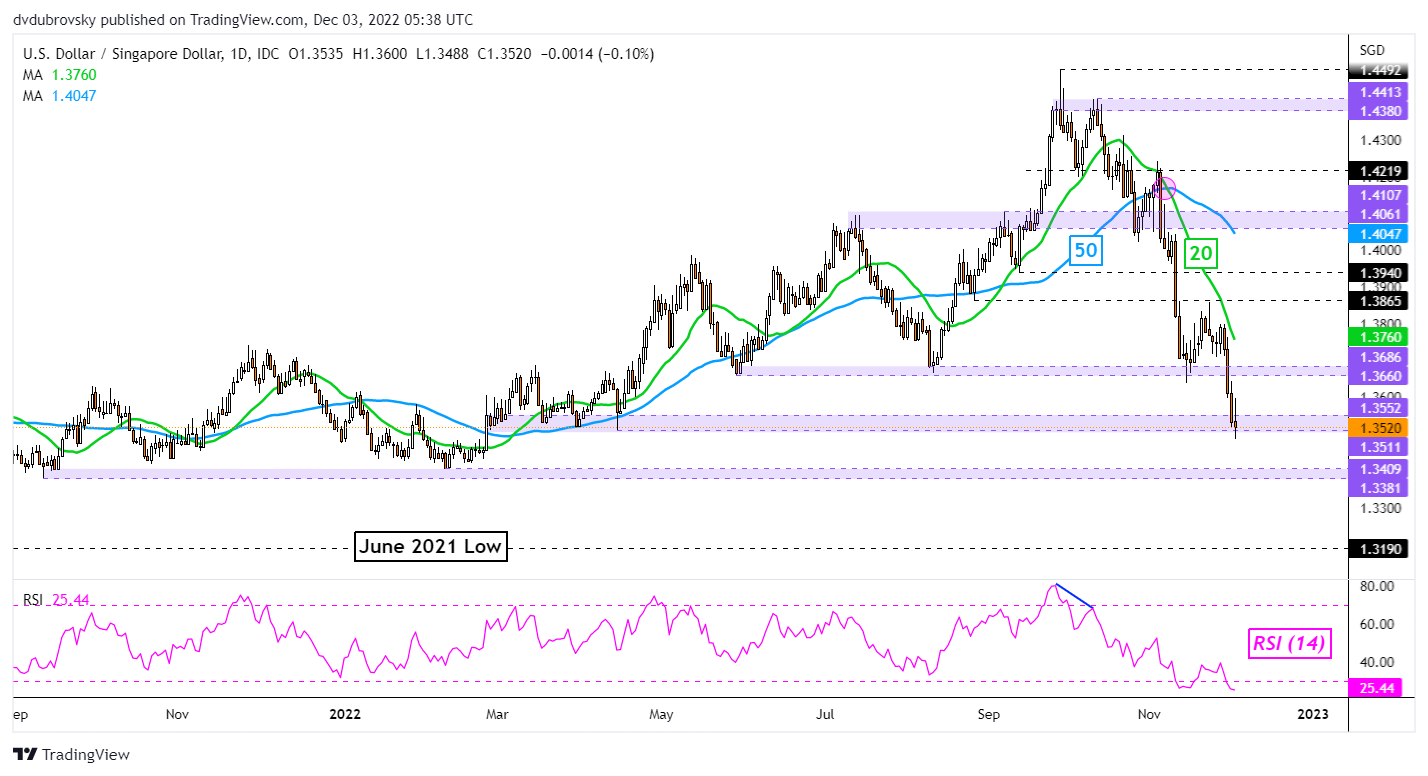
The Singapore Dollar extended its advance against the US Dollar last week. In November, USD/SGD sank 3.84%. That was the best performance for SGD since March 2016. Where does this leave the pair heading into the new week? Keep a close eye on the 1.3511 – 1.3552 support zone. A confirmatory downside breakout would open the door to extending the downtrend, exposing lows from September 2021. In the event of a turn higher, keep a close eye on the 20-day Simple Moving Average (SMA). This could reinstate the downside focus.
USD/SGD Daily Chart
Indonesian Rupiah Technical Outlook – Bullish
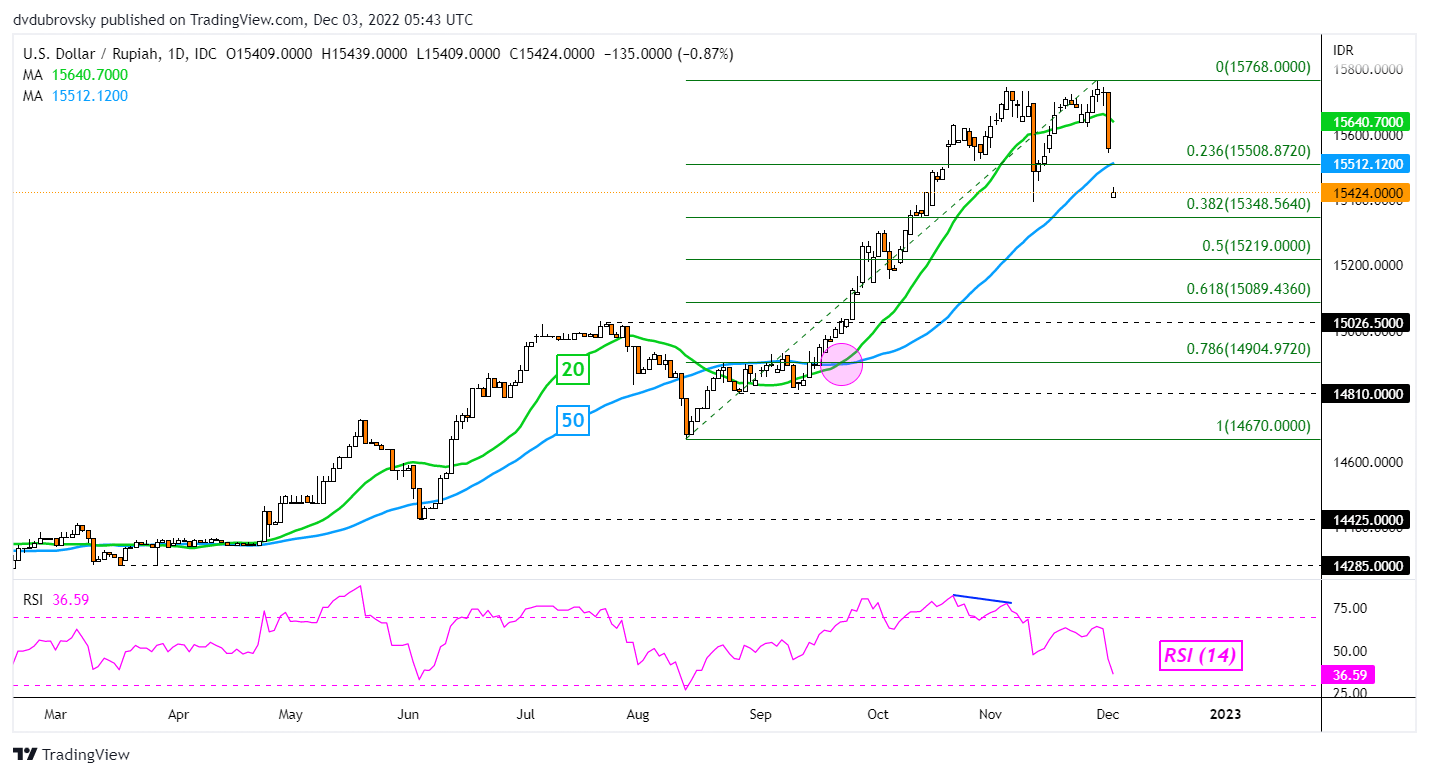
The US Dollar also weakened against the Indonesian Rupiah, sending USD/IDR down 1.57% last week. That was the worst 5-day period since November 2020. Moreover, the pair broke under the 50-day SMA, opening the door to an increasingly downside bias ahead. Keep a close eye on the 20-day SMA, it could cross under the 50, creating a bearish Death Cross. Immediate support is the 38.2% Fibonacci retracement level at 15348. Further losses would expose the midpoint of the retracement at 15219. In the event of a turn higher, a push above the 23.6% level at 15508 would place the focus on the November high at 15768.
USD/IDR Daily Chart
Philippine Peso Technical Outlook – Bullish
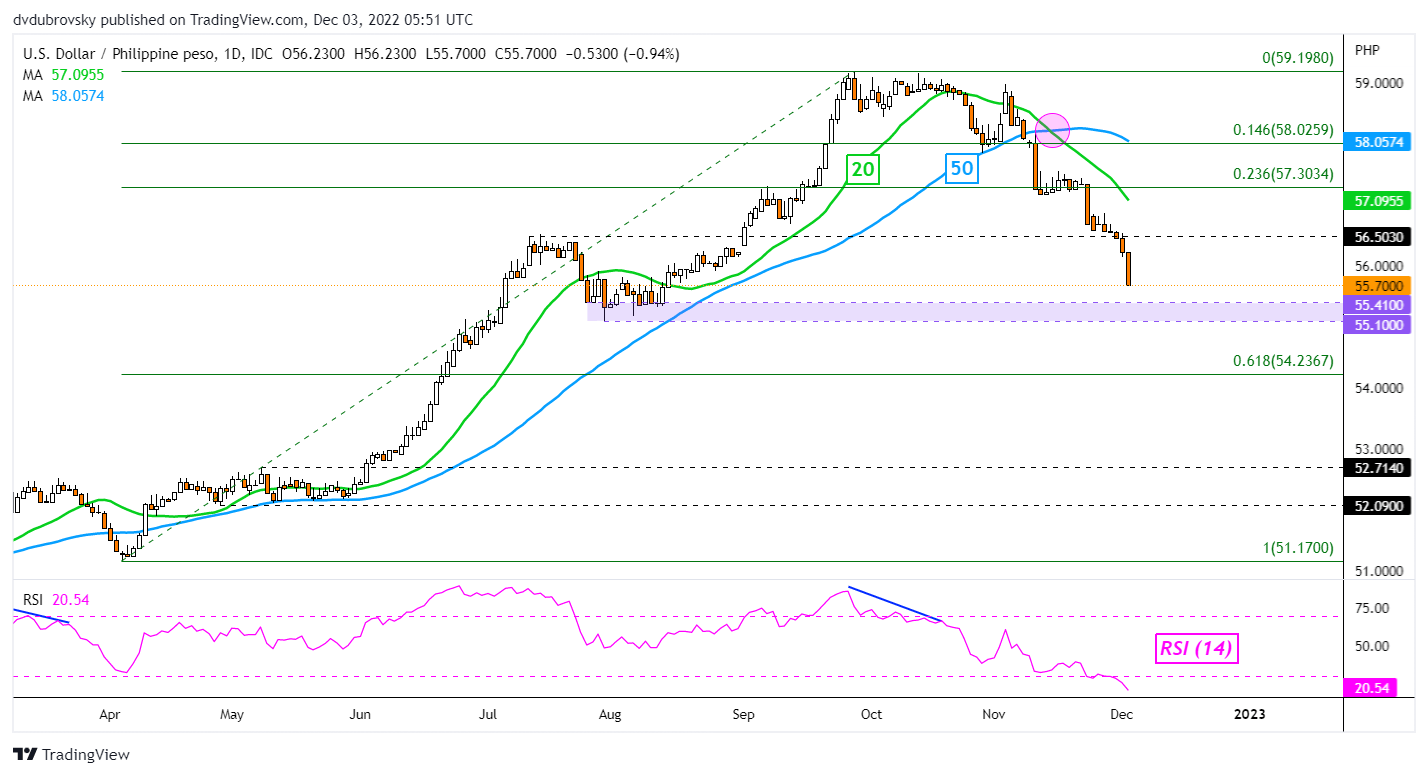
The US Dollar is also quickly losing its upside progress earned earlier this year against the Philippine Peso. USD/PHP fell 2.77% in November, the worst month since March 2016. This has left USD/PHP facing August lows, making for a key zone of support between 55.10 and 55.41. This might be tricky to clear, but doing so would offer an increasingly bullish outlook for PHP, exposing the 61.8% Fibonacci retracement level at 54.236. In the event of a turn higher, key resistance could be the 56.503 inflection point before the 20-day SMA comes into focus.

USD/PHP Daily Chart
Thai Baht Technical Outlook – Bullish
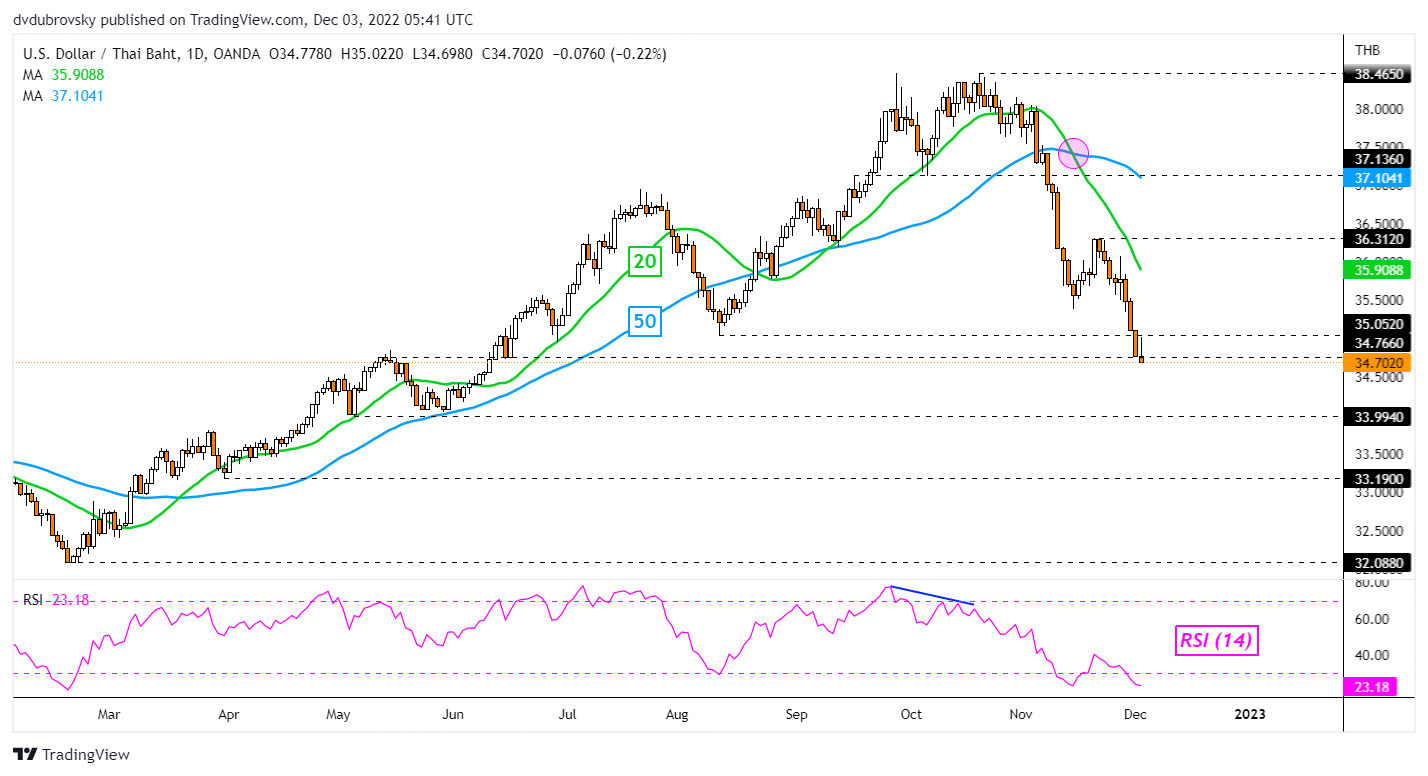
The US Dollar is also quickly losing ground against the Thai Baht, with USD/THB sinking 7.63% in November. That was the worst month since March 1998! Heading into the new week, USD/THB is facing the May low at 33.994. In the event of a turn higher, key resistance could be the 35.052 inflection point. Beyond that the 20-day SMA would likely quickly follow, offering an opportunity to maintain the dominant downside focus.
USD/THB Daily Chart
--- Written by Daniel Dubrovsky, Senior Strategist for DailyFX.com
To contact Daniel, follow him on Twitter:@ddubrovskyFX


