


USD Technical Outlook
- US Dollar Index (DXY) in lofty territory, reversal could develop relatively soon
- Panic selling in GBP is helping propel the index higher, but is subsiding

US Dollar Technical Analysis: Panic Driving DXY Higher into Lofty Levels
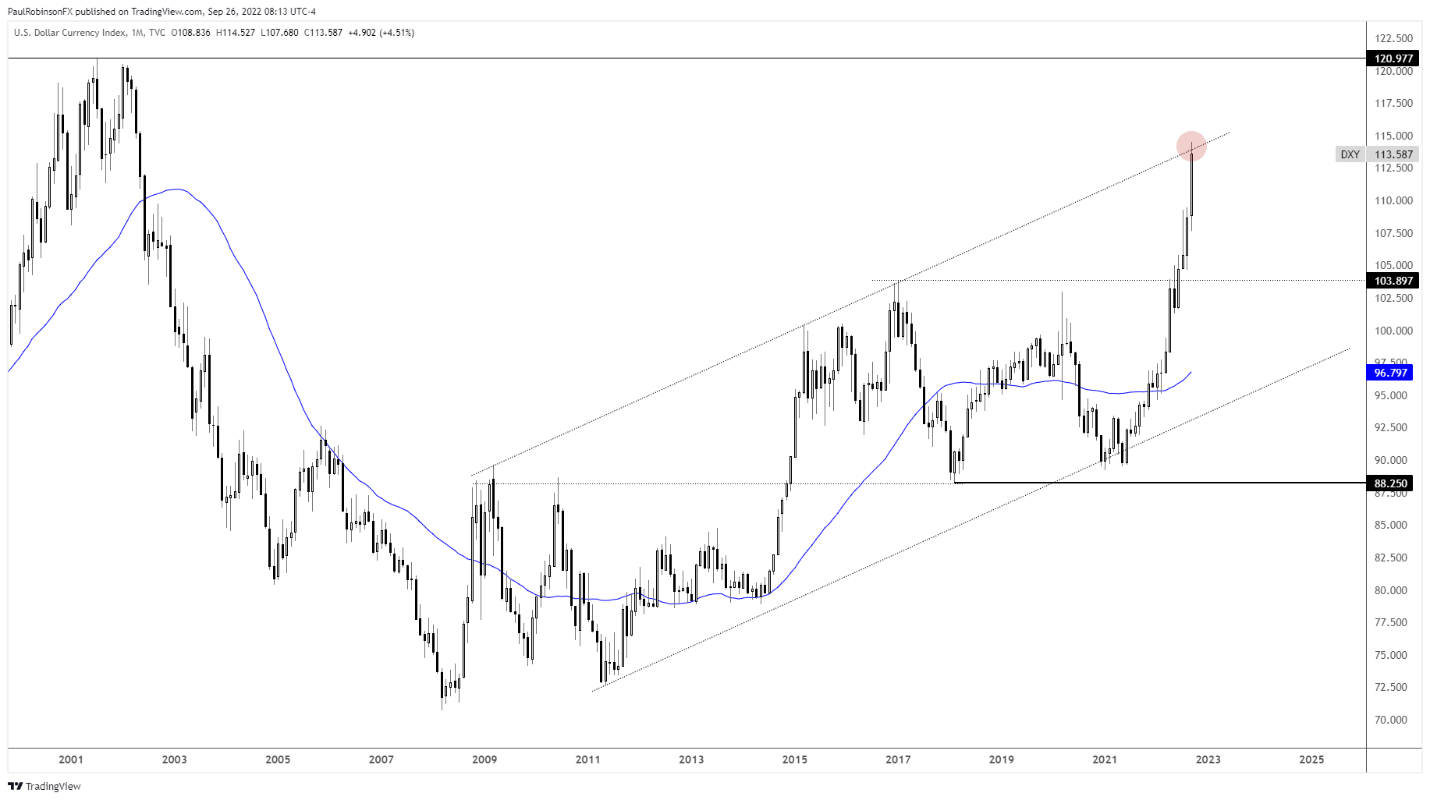
The US Dollar Index (DXY) continues to push into lofty territory with a meaningful top-side slope coming into play and the 2001 high not that far away at 121. The slope is something we need to worry about now, but given it extends higher from 2009 we need to give it wiggle room and look to the weekly/monthly charts.
Top-side slopes running in the direction of an uptrend (slope = resistance) makes the line a little less meaningful as resistance than if it were an upward slope rising up as support. With that in mind, it is still to be respected, but of course only if the proper price action unfolds.
Given the age of the line we need to look to the weekly and monthly charts for guidance. Daily play around the line has less meaning. We could see the line exceeded from day to day, but if on a weekly or monthly closing basis the DXY fails to cross over it and/or reverses shortly after exceeding resistance, then it could have sizable ramifications.
If we don’t see sellers step in soon, the 2001 highs are up next as resistance to watch. Whether we see it on this run or not is to be seen, but it may be a stretch without first seeing a pullback develop. The thinking for awhile now has been the summer pullback in the dollar and rally in stocks would give-way to a resumption of trends dating to the beginning of the year. October has been a tentative time-frame for thinking we could see a low in stocks, pullback in the dollar, as seasonality trends favor such a scenario.
The S&P 500 is nearing a new low but not there yet, and on that it seems likely we will see a meaningful new low in stocks first before a big bounce develops. If this is the case then the dollar is very likely to continue holding a bid to acting quite strong.
GBP went into full-on panic mode Friday into the early hours of Sunday trading, but we have since seen a big reversal. GBP is only a small portion of the DXY index, but when it is swinging around 3-5% its impact on the DXY will be felt. It looks/feels like we might have a short-term low in GBP, but expect volatility to remain high.

US Dollar Index (DXY) Monthly Chart
Resources for Forex Traders
Whether you are a new or experienced trader, we have several resources available to help you; indicator for tracking trader sentiment, quarterly trading forecasts, analytical and educational webinars held daily, trading guides to help you improve trading performance, and one specifically for those who are new to forex.
---Written by Paul Robinson, Market Analyst
You can follow Paul on Twitter at @PaulRobinsonFX


