


US Dollar, USD/SGD, USD/IDR, USD/THB, USD/PHP – ASEAN Technical Analysis
- US Dollar traded mixed against ASEAN currencies last week
- Singapore Dollar is setting up for the most aggressive push
- What about USD/IDR, USD/THB and USD/PHP?

Singapore Dollar Technical Outlook – Bullish
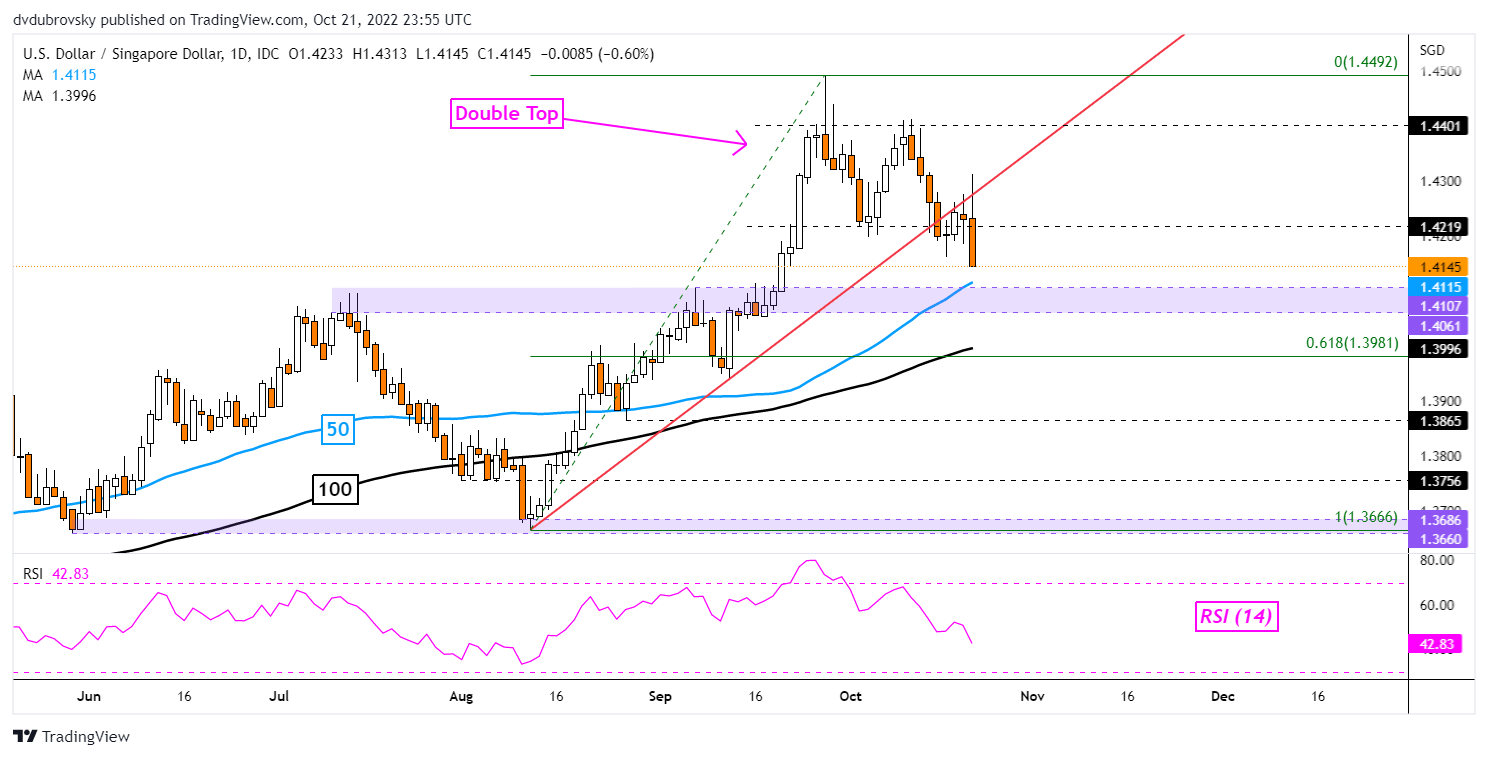
The US Dollar is trading at its weakest against the Singapore Dollar since September after USD/SGD made strong downside progress last week. Prices broke under the rising trendline from August. Moreover, it seems the pair has confirmed a breakout under a bearish Double Top chat formation. That could open the door to extending losses. Key support seems to be the 1.4061 – 1.4107 inflection zone. Below that, the 100-day Simple Moving Average (SMA) could kick in, reinstating the upside focus.
USD/SGD Daily Chart
Indonesian Rupiah Technical Outlook – Bearish
The US Dollar continued making upside progress against the Indonesian Rupiah, with USD/IDR pushing to its highest since April 2020. A bullish Golden Cross remains between the 20- and 50-day Simple Moving Averages, offering a bullish bias. These could reinstate the upside focus in the event of a turn lower. Immediate resistance is the 78.6% Fibonacci extension at 15663. Beyond that is the 100% level at 15800.
Trade Smarter - Sign up for the DailyFX Newsletter
Receive timely and compelling market commentary from the DailyFX team
USD/IDR Daily Chart
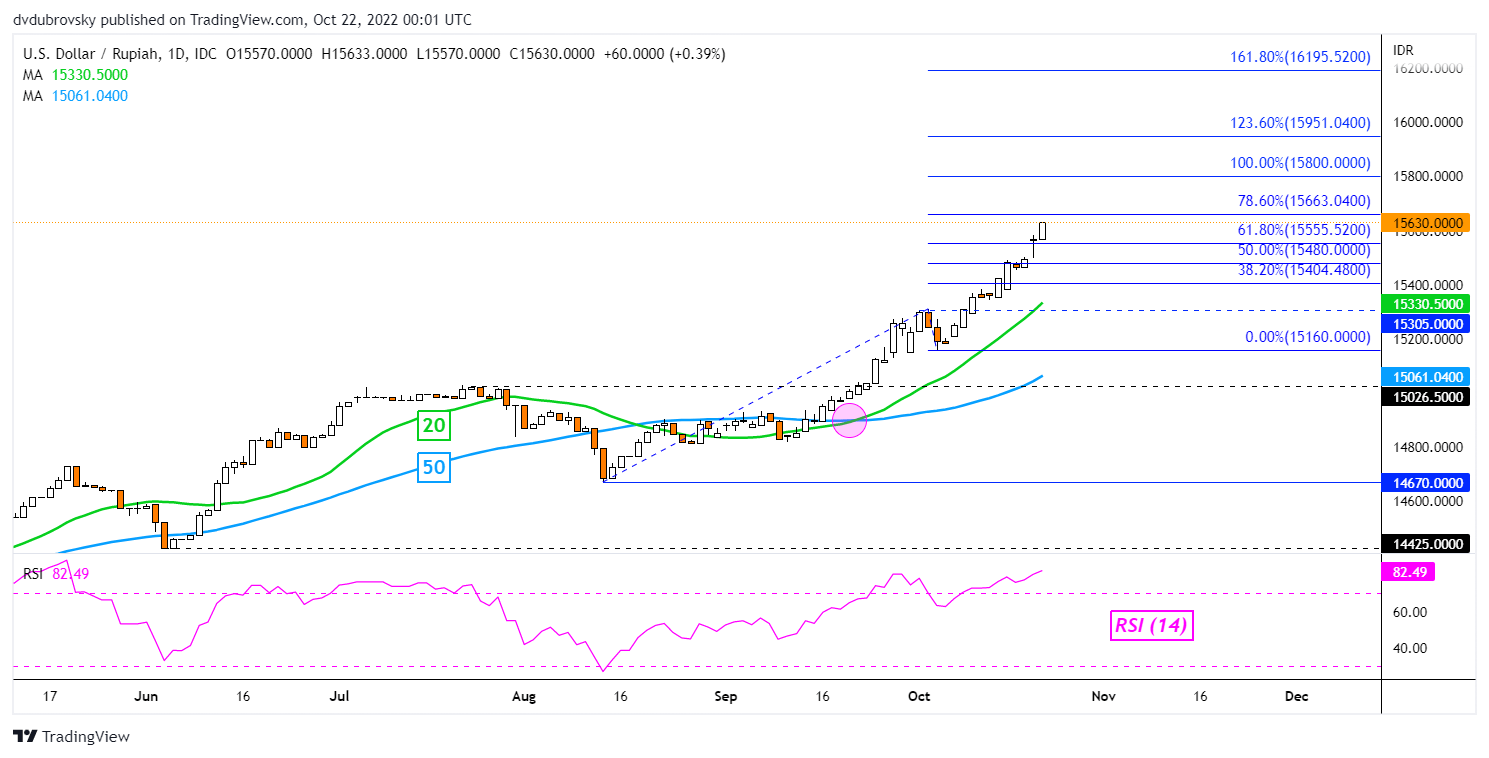
Chart Created in TradingView
Thai Baht Technical Outlook – Slightly Bearish
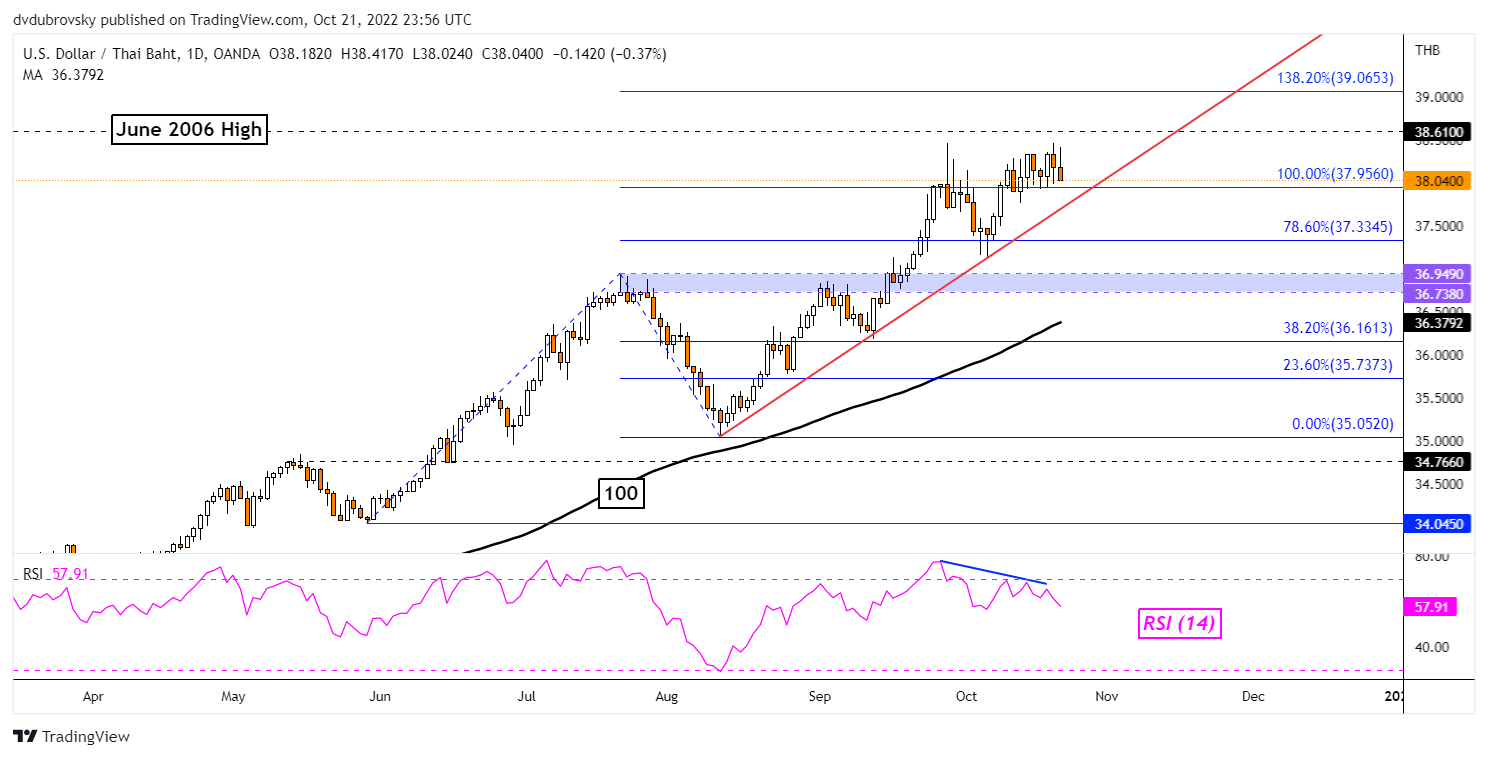
The US Dollar slowed its ascent against the Thai Baht this past week. This followed the presence of negative RSI divergence, showing that USD/THB upside momentum was fading. Such an occurrence could warn that a turn lower may be a possibility ahead. Still, keep a close eye on the rising trendline from August. It could reinstate the upside focus towards the June 2006 high at 38.61. Otherwise, breaking under exposes the 100-day SMA.
USD/THB Daily Chart
Philippine Peso Technical Outlook – Neutral
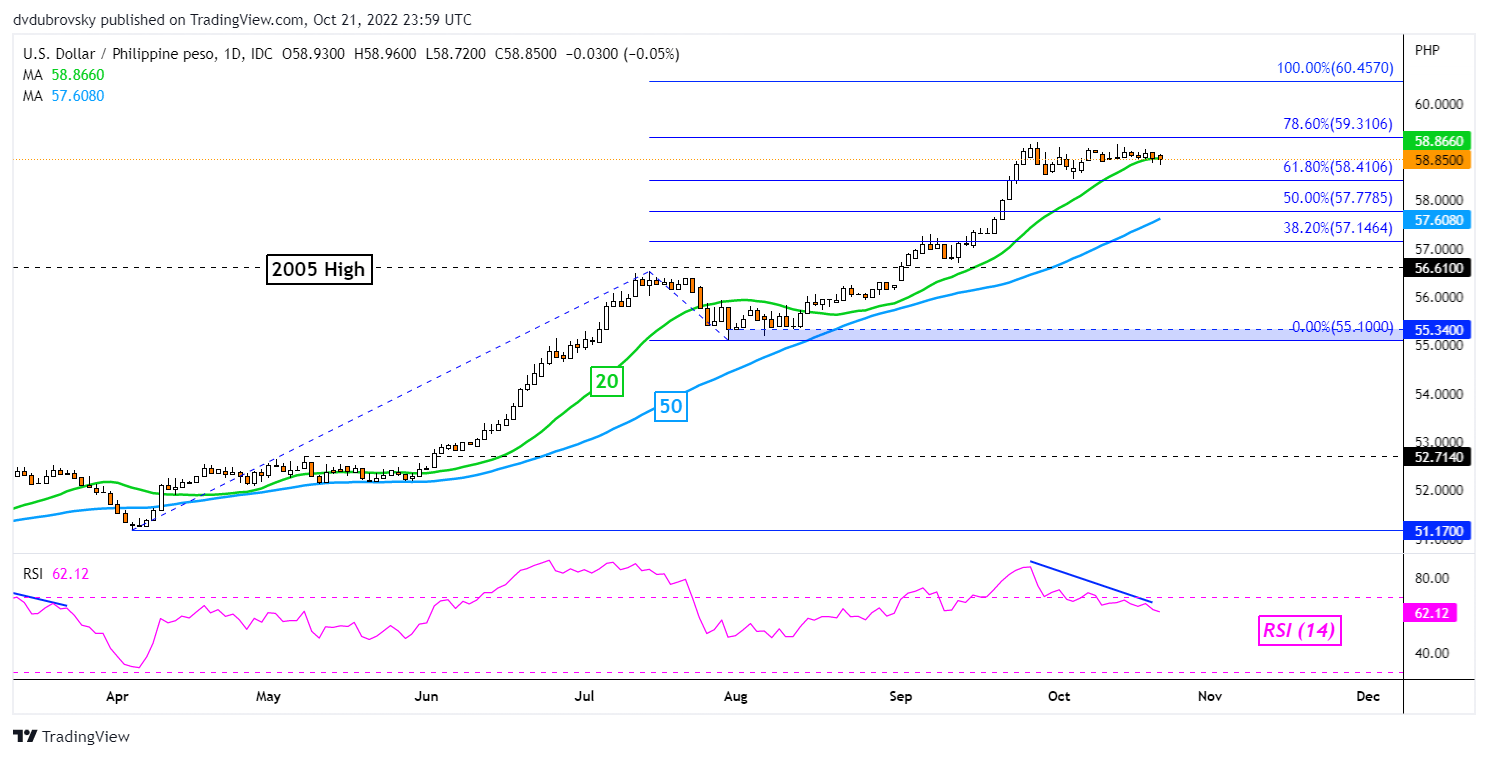
The US Dollar continues to mark time against the Philippine Peso. USD/PHP has been trading in a narrow range between 58.41 and 59.31 since the middle of September. There is some potential for currency intervention here. The Philippine Central Bank has let markets know in recent days that it is ready to use tools to bring volatility down in the currency. Traders out to proceed with caution in the event of further gains. Negative RSI divergence is present, showing that upside momentum is fading. A turn lower places the focus on the 20- and 50-period SMAs.

USD/PHP Daily Chart
--- Written by Daniel Dubrovsky, Strategist for DailyFX.com
To contact Daniel, use the comments section below or@ddubrovskyFXon Twitter


