


US Dollar, USD/SGD, USD/THB, USD/IDR, USD/PHP – ASEAN Technical Analysis
- US Dollar continues to weaken against most ASEAN currencies
- Singapore Dollar and Thai Baht appear increasingly bullish
- Philippine Peso remains neutral, Indonesian Rupiah seems bearish

Singapore Dollar Technical Outlook – Slightly Bullish
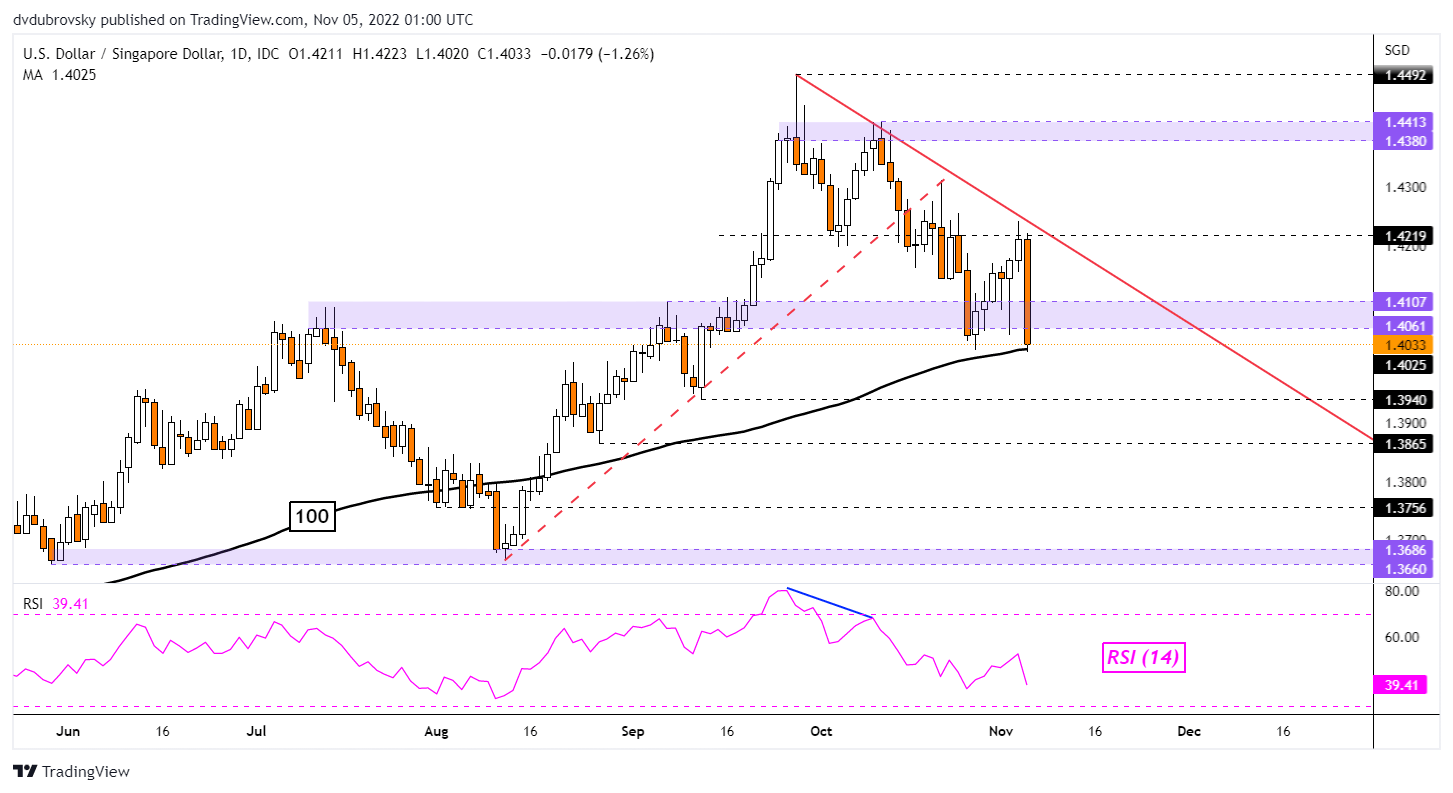
The Singapore Dollar gained 1.26% against the US Dollar last Friday, the best single-day performance since June 2016. That has left USD/SGD once again trying to break under the 1.4107 – 1.4061 former resistance zone. Prices are testing the 100-day Simple Moving Average (SMA). It remains in play as key support. Confirming a breakout opens the door to downtrend extension and an increasingly bullish perspective for the Singapore Dollar.
USD/SGD Daily Chart
Thai Baht Technical Outlook – Slightly Bullish
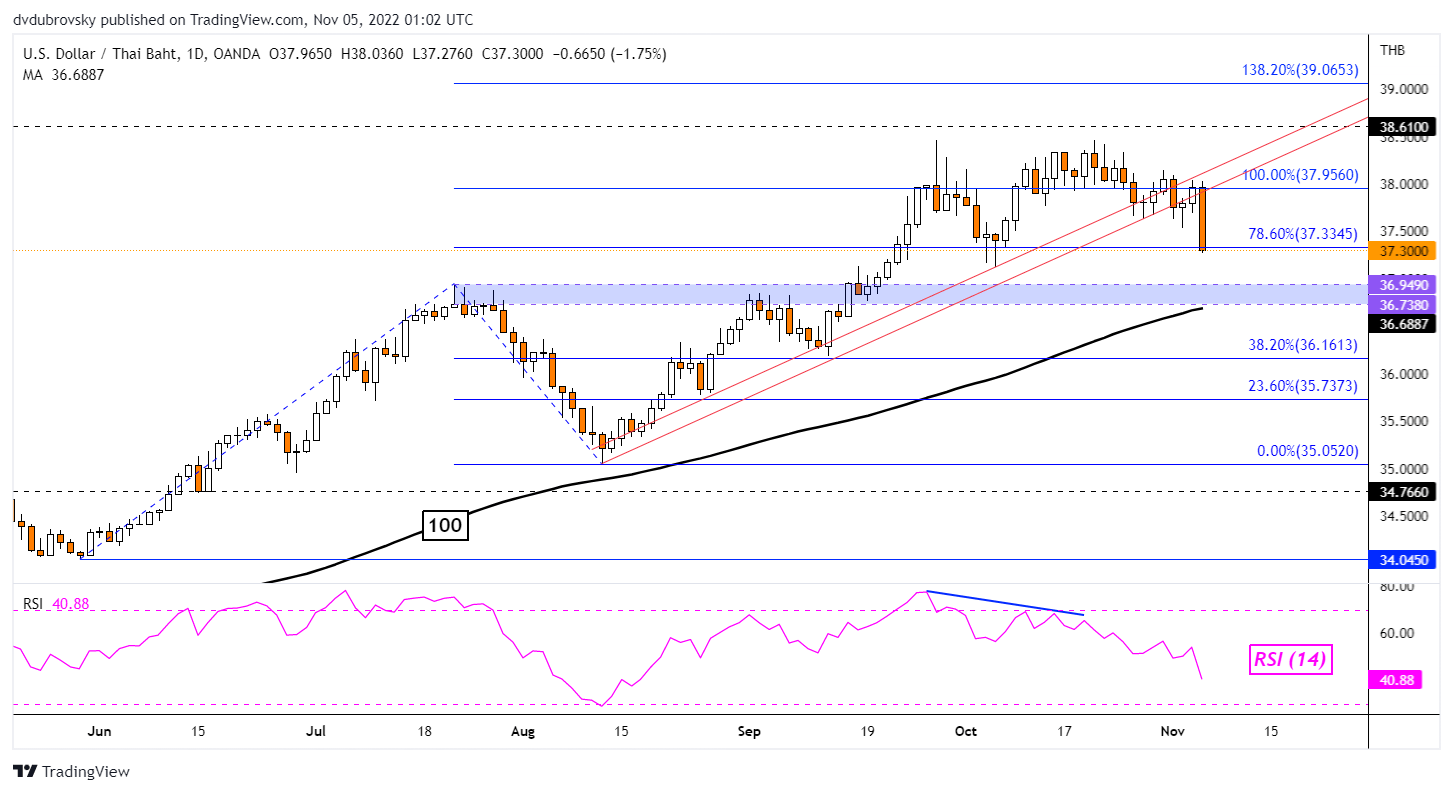
The Thai Baht gained an impressive 1.71% against the US Dollar last Friday. That was the best day for the currency since August 2007! Moreover, USD/THB has broken under the near-term rising trendline from August, offering an increasingly bullish outlook. Key support is the 36.949 – 36.738 former resistance zone, as well as the 100-day SMA. These could hold, pivoting prices higher. In the event of a turn higher, the August trendline could hold as new resistance.
USD/THB Daily Chart
Indonesian Rupiah Technical Outlook – Bearish
Meanwhile, the US Dollar continued to make progress against the Indonesian Rupiah. USD/IDR confirmed a breakout above the 78.6% Fibonacci extension at 15663, exposing the 100% level at 15800. Keep a close eye on RSI. Negative divergence is present. This could hint at a reversal. A turn lower would place the focus on the 20-day SMA, which may reinstate the broader upside bias. Otherwise, below that is the 50-day SMA.
Trade Smarter - Sign up for the DailyFX Newsletter
Receive timely and compelling market commentary from the DailyFX team
USD/IDR Daily Chart
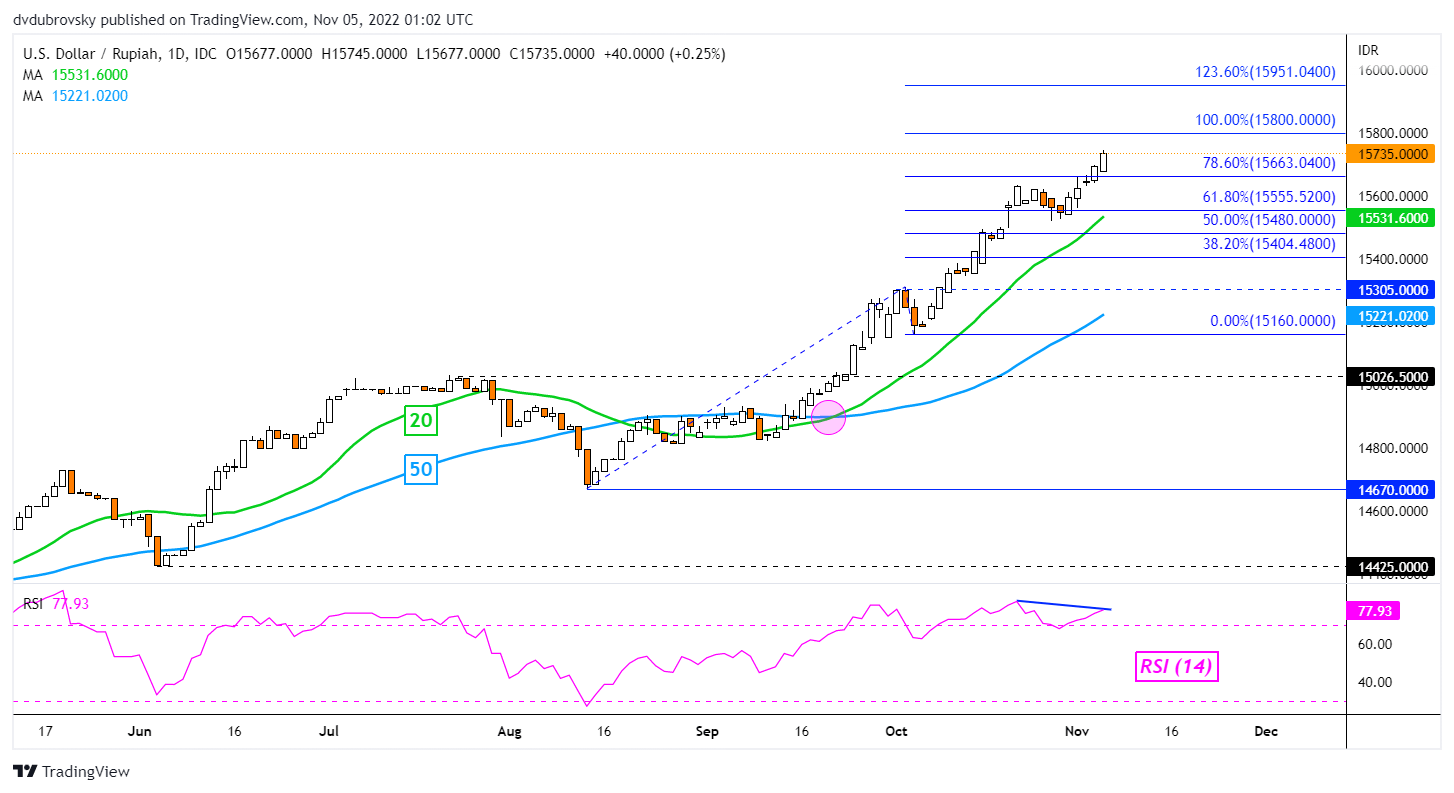
Chart Created in TradingView
Philippine Peso Technical Outlook – Neutral
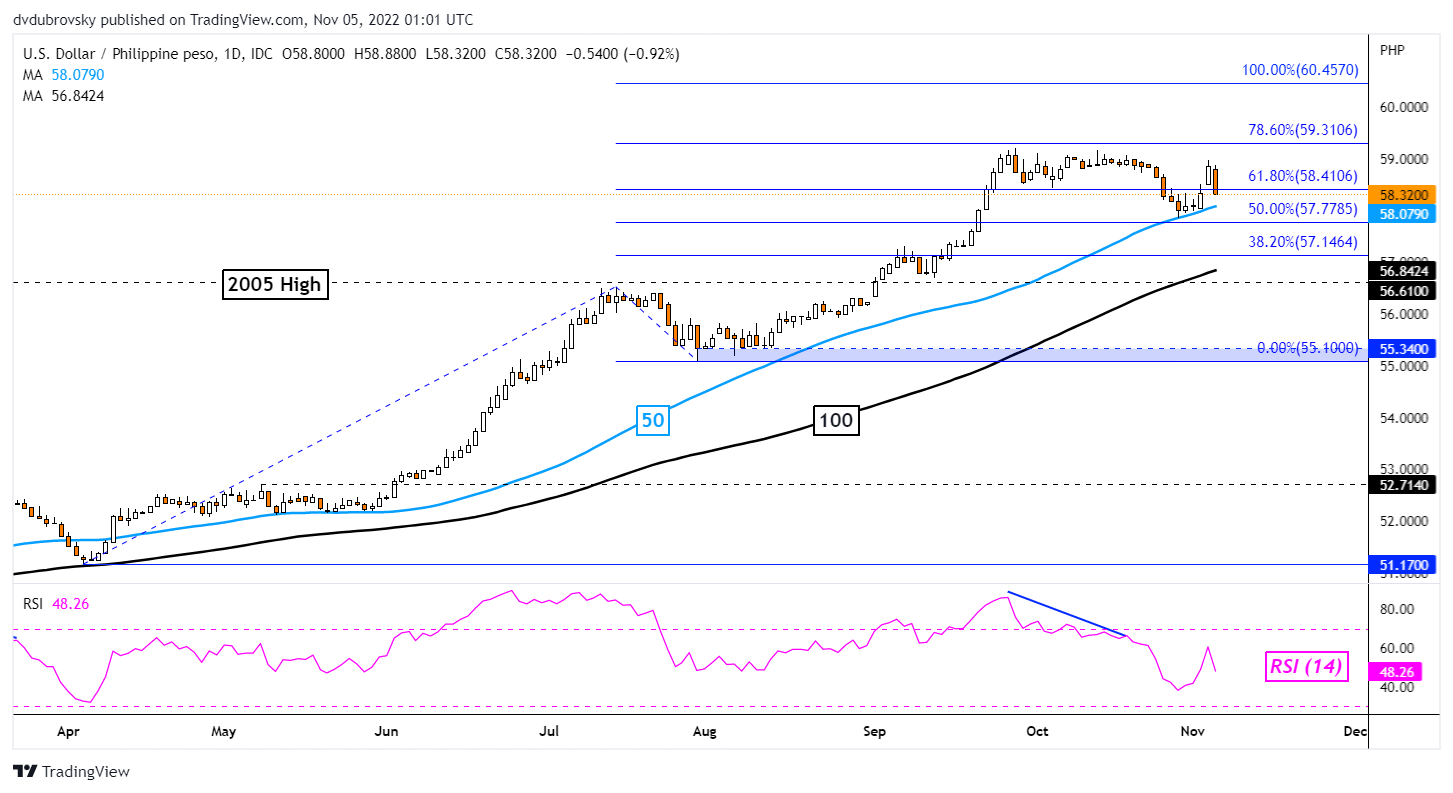
The Philippine Peso was mostly flat against the US Dollar this past week. Prices remain in a consolidative state since USD/PHP upside momentum faded in late September. Still, the pair is trading above both the 50- and 100-day SMAs. These are maintaining the broader upside focus despite recent consolidation. If these hold and pivot USD/PHP higher, the 78.6% Fibonacci extension level at 59.310 would come into focus before the 100% point at 60.457.

USD/PHP Daily Chart
--- Written by Daniel Dubrovsky, Senior Strategist for DailyFX.com
To contact Daniel, follow him on Twitter:@ddubrovskyFX


