


S&P 500, NASDAQ - TECHNICAL OUTLOOK:
- The S&P 500 is risking a break below a long-term moving average.
- The Nasdaq Composite Index risks another leg lower, possibly lasting for a few weeks.
- How much more downside is likely ahead and what are the key levels to watch?

S&P 500 SHORT-TERM TECHNICAL OUTLOOK - BEARISH
US equity benchmark indices are looking vulnerable as they test crucial support, risking another leg lower in the coming weeks.
The S&P 500 index is testing key converged support on the 200-week moving average, roughly coinciding with the June low of 3640. The index was last decisively below the four-year moving average during the Covid selloff in 2020 and the 2007-2009 Great Financial Crisis. Any break below could push the index lower towards the 2020 high of 3394, followed by the September 2020 low of 3249.
S&P 500 Daily Chart
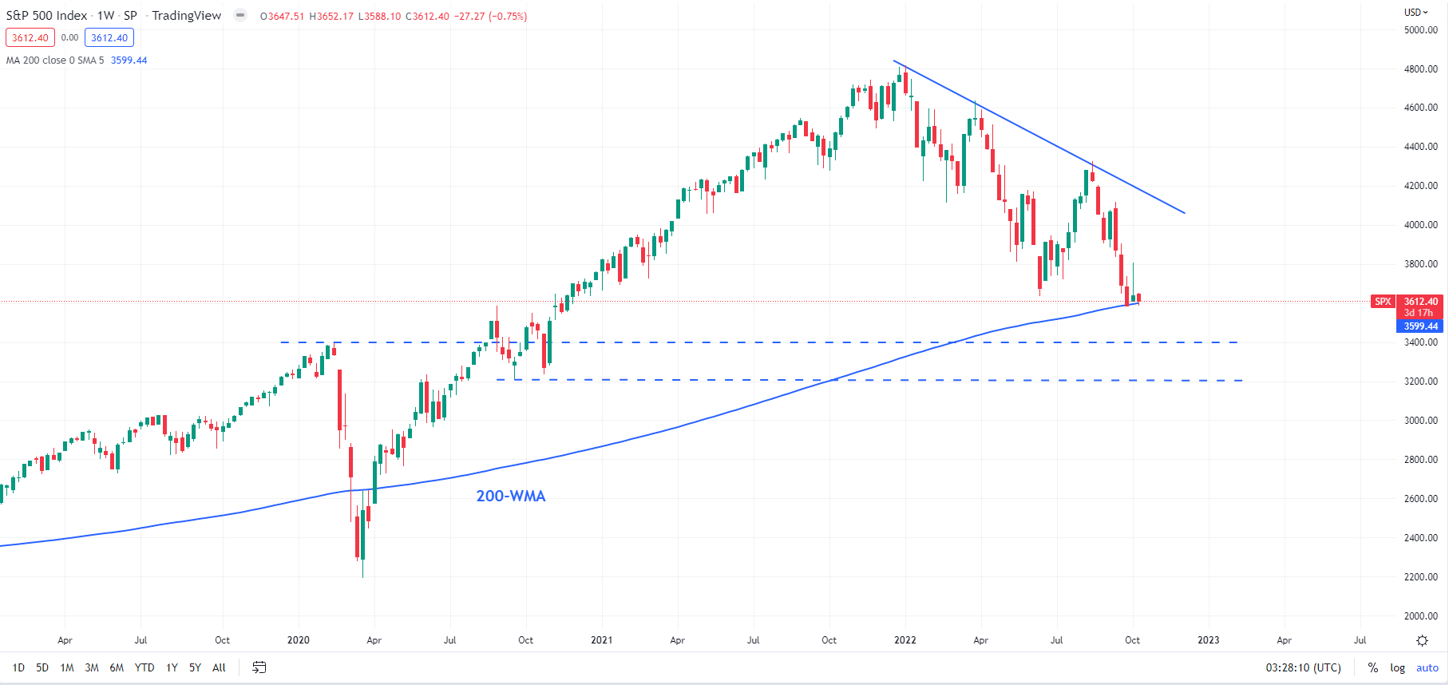
Chart Created Using TradingView
Despite the 17% fall since August, there is no sign of reversal yet, notwithstanding a minor positive divergence on the weekly chart (falling index associated with a stalling/rising momentum). Unless the index is able to break past immediate resistance at last week’s high of 3807, the trend remains bearish. For medium-term downward pressure to fade, the index would need to rise above resistance on the 200-day moving average (now at about 4185). For the moment, momentum on the monthly chart continues to point to further weakness.

NASDAQ COMPOSITE INDEX SHORT-TERM TECHNICAL OUTLOOK – BEARISH
The Nasdaq Composite Index is threatening to break below fairly strong support at the June low of 10565. The feeble/shallow rebounds since August seem to raise the odds of a break lower. If history is any guide, a break below support could imply about one or two more months of downtrend (see chart).
NASDAQ COMPOSITE Weekly Chart
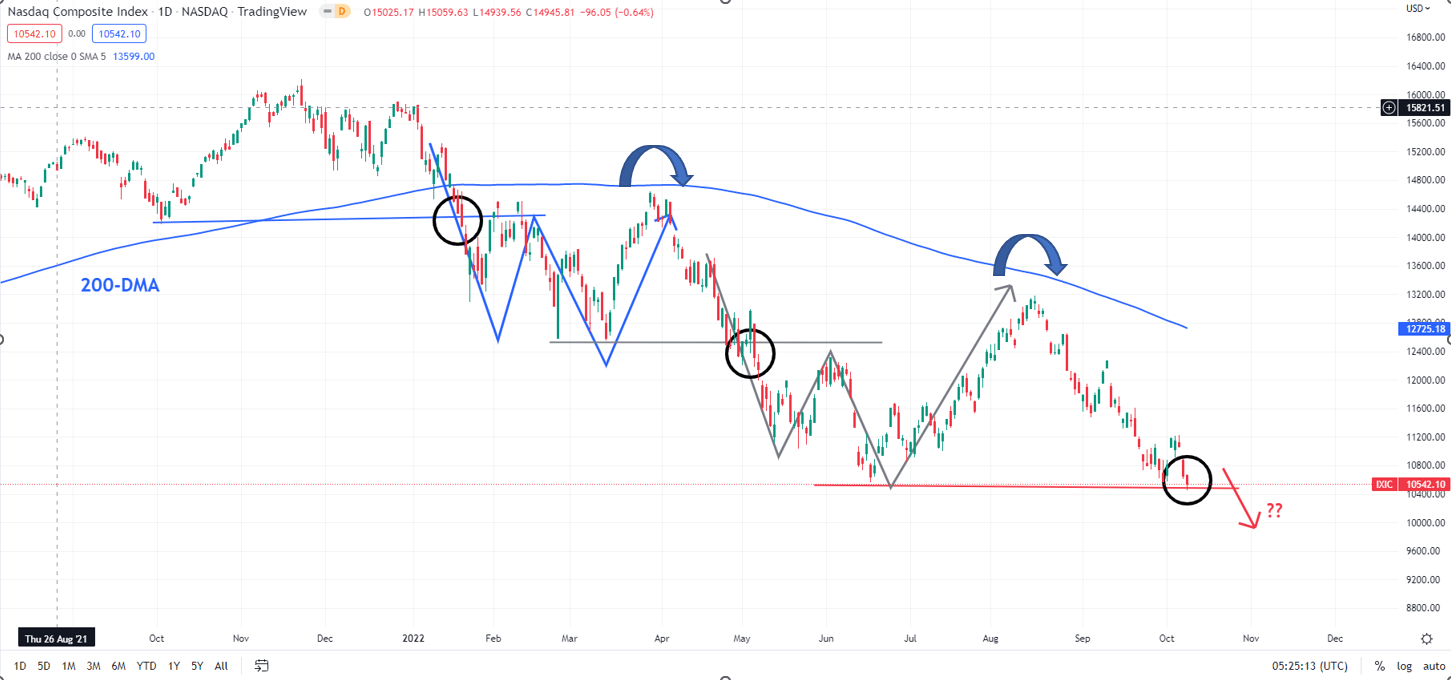
Chart Created Using TradingView
January’s fall below key support at the October 2021 low saw weakness persist until mid-March. Similarly, May’s drop below the February-March lows dragged the index lower until mid-June. Hence any break below the June low suggests that the index could maintain a soft bias until the end of the year.
In terms of the extent of the decline, the January and the March breakouts triggered down moves of around 12%-15%. Assuming the lower end of this range, the potential target would work out to around 9275. Strong support is at the pre-Covid high of 9838. For the medium-term downtrend to change/reverse, at minimum, the index needs to break above the 200-day moving average (now at about 12725) – the two rebounds this year have run out of steam at the average.

--- Written by Manish Jaradi, Strategist for DailyFX.com


