


S&P 500 and Nasdaq 100 – Technical Forecasts and Analysis
- S&P 500 testing an important longer-term downtrend.
- Nasdaq 100 struggling to hold gains despite trend break.

US equity markets are giving back some of their weekly gains after the latest labor report showed that the US jobs market remains resilient. The NFP release - 263k jobs created vs expectations of 200k - turned risk markets negative on the day, with US stocks markets between 1% and 1.5% as we write. Despite the losses, US indices remain in positive territory for the week, aided on Wednesday by a mildly dovish speech from Fed chair Jerome Powell.
Euro (EUR) Latest: EUR/USD Set for Further Gains After Fed Powell’s Dovish Nudge
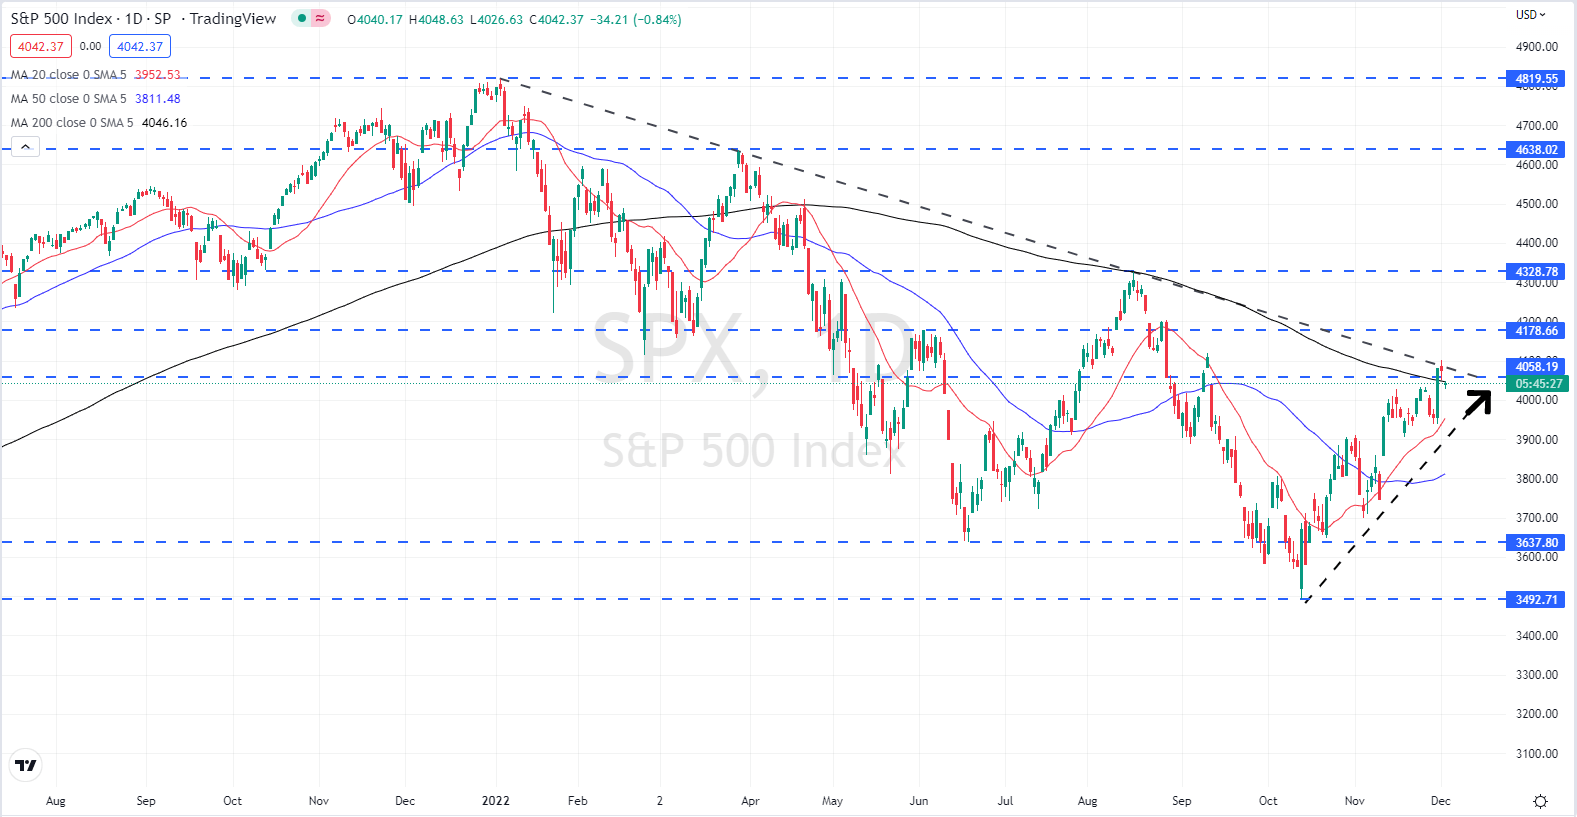
The S&P 500 is currently pressing against a longer-term downtrend off the January 2022 high. This trend – lower highs and lower lows – is being challenged by a shorter-term uptrend off the October 13 low, with yesterday’s attempted break rejected. In addition, the 200-day moving average is also in play, adding to a mixed technical picture. A confirmed break higher should see further gains for the S&P 500 with the August 16 swing high at 4328 as the next significant target.
S&P 500 Daily Price Chart – December 2, 2022
| Change in | Longs | Shorts | OI |
| Daily | 1% | -1% | 0% |
| Weekly | 15% | -13% | -1% |
Retail trader data shows 42.06% of traders are net-long with the ratio of traders short to long at 1.38 to 1.The number of traders net-long is 3.89% higher than yesterday and 5.03% lower from last week, while the number of traders net-short is 0.69% lower than yesterday and 1.41% higher from last week.
We typically take a contrarian view to crowd sentiment, and the fact traders are net-short suggests US 500 prices may continue to rise. Positioning is less net-short than yesterday but more net-short from last week. The combination of current sentiment and recent changes gives us a further mixed US 500 trading bias.
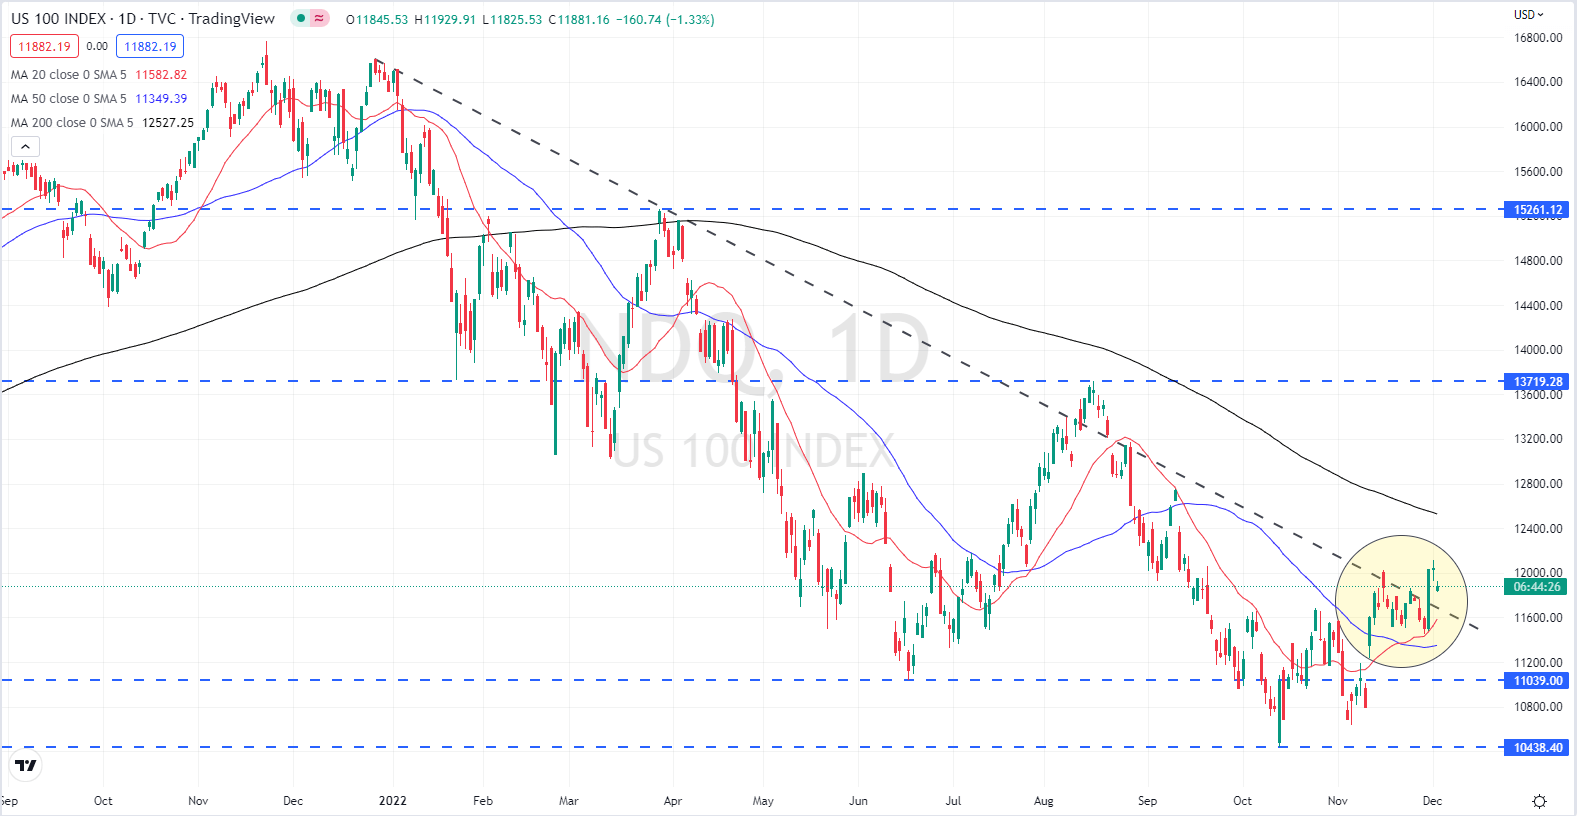
The Nasdaq 100 chart also shows a dominant downtrend but this has been broken by the short-term uptrend, adding a slightly more positive bias to the chart. Again the outlook is mixed, this time due to the current price being way below the 200-day moving average – spot price at 11,883 vs. 200-dma at 12,527. For the Nasdaq’s sentiment to turn longer-term positive, both the 200-dma and the mid-August swing high at 13,719 will need to be reclaimed, and that looks like a very difficult proposition in the current market climate.
Nasdaq 100 Daily Price Chart – December 2, 2022
For all market-moving data releases and economic events see the real-time DailyFX Calendar.

What is your view on US Indices – bullish or bearish?? You can let us know via the form at the end of this piece or you can contact the author via Twitter @nickcawley1.


