


NZD/USD, NEW ZEALAND DOLLAR - Technical Outlook:
- NZD/USD is attempting to break above key resistance.
- While a short-term rebound is possible, NZD/USD’s medium-term trend remains down.
- What is the outlook and the signposts to watch?

NZD/USD SHORT-TERM TECHNICAL FORECAST – BULLISH
Improving upward momentum on shorter-term charts opens the door for some more gains in the New Zealand Dollar against the US Dollar. However, the underlying medium-term bearish pressure is likely to cap its gains.
On the 4-hour chart, NZD/USD’s break above the median line of a rising pitchfork channel from October suggests the pair has shifted to a ‘higher gear’ within the nascent recovery trend. It is now attempting to break above crucial resistance at the October 6 high of 0.5815. A decisive breach could open the way toward 0.6000-0.6050 (which includes the 50% retracement of the August-October fall).
NZD/USD 4-Hour Chart
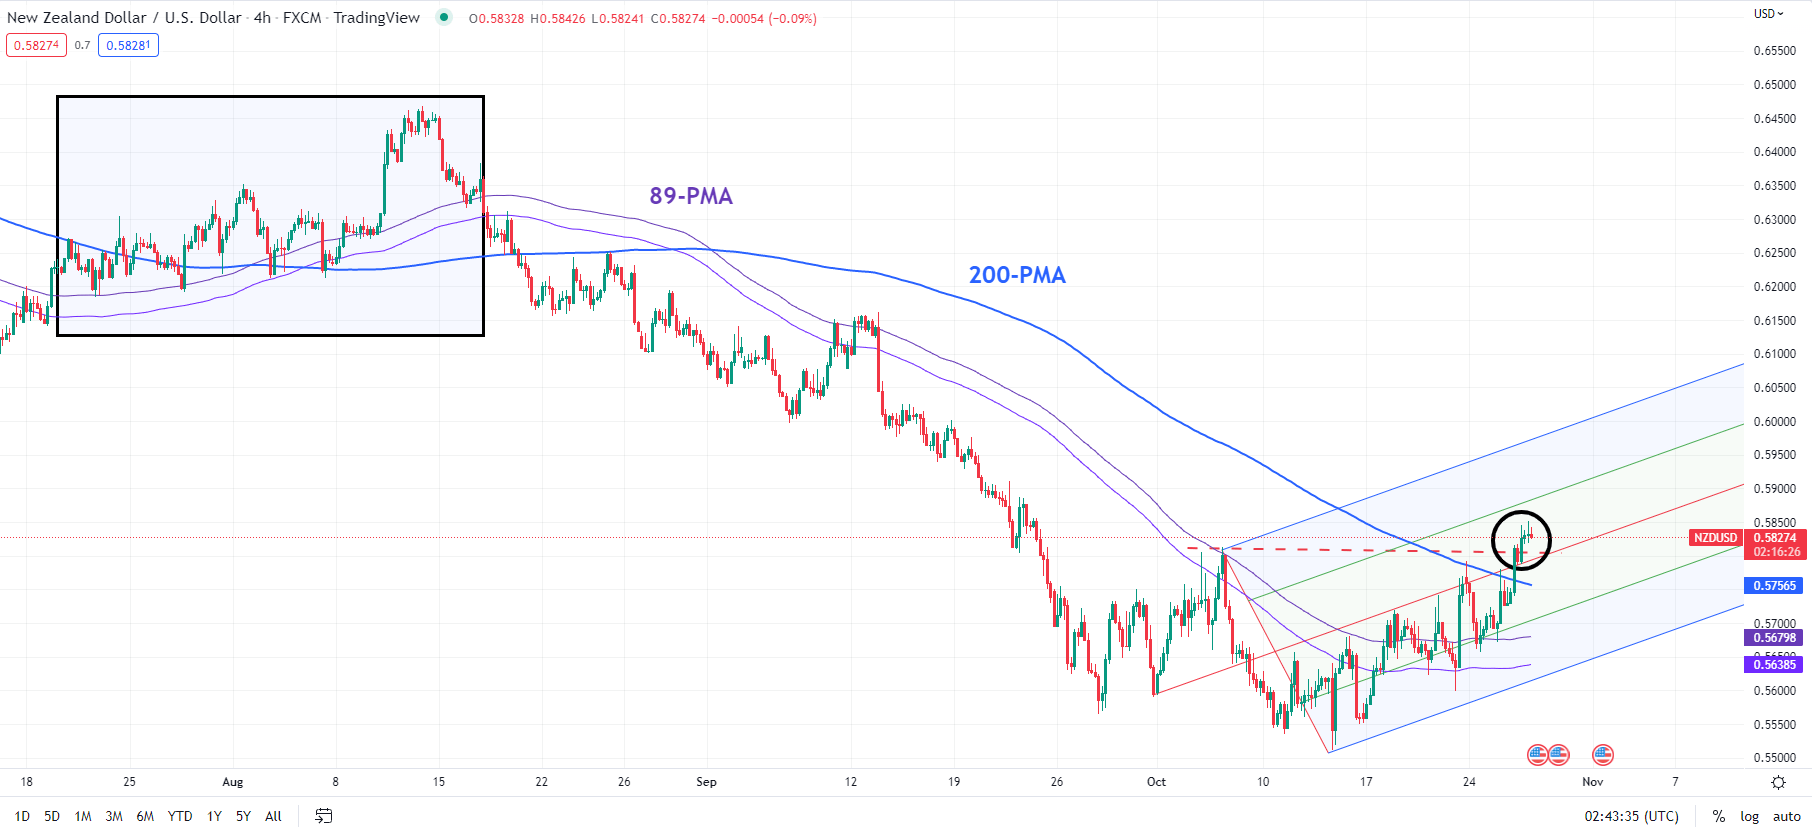
Chart Created Using TradingView
Despite the choppy price action over the past few weeks, NZD/USD has made higher highs and higher lows, indicating an uptrend in the interim. This follows a hold near major support at the 2020 low of 0.5470 from oversold conditions on higher timeframe charts, a strong Bullish Engulfing pattern on the weekly candlestick chart, and a potential Piercing pattern on the monthly candlestick chart (to be confirmed at the end of this month).
NZD/USD Weekly Chart
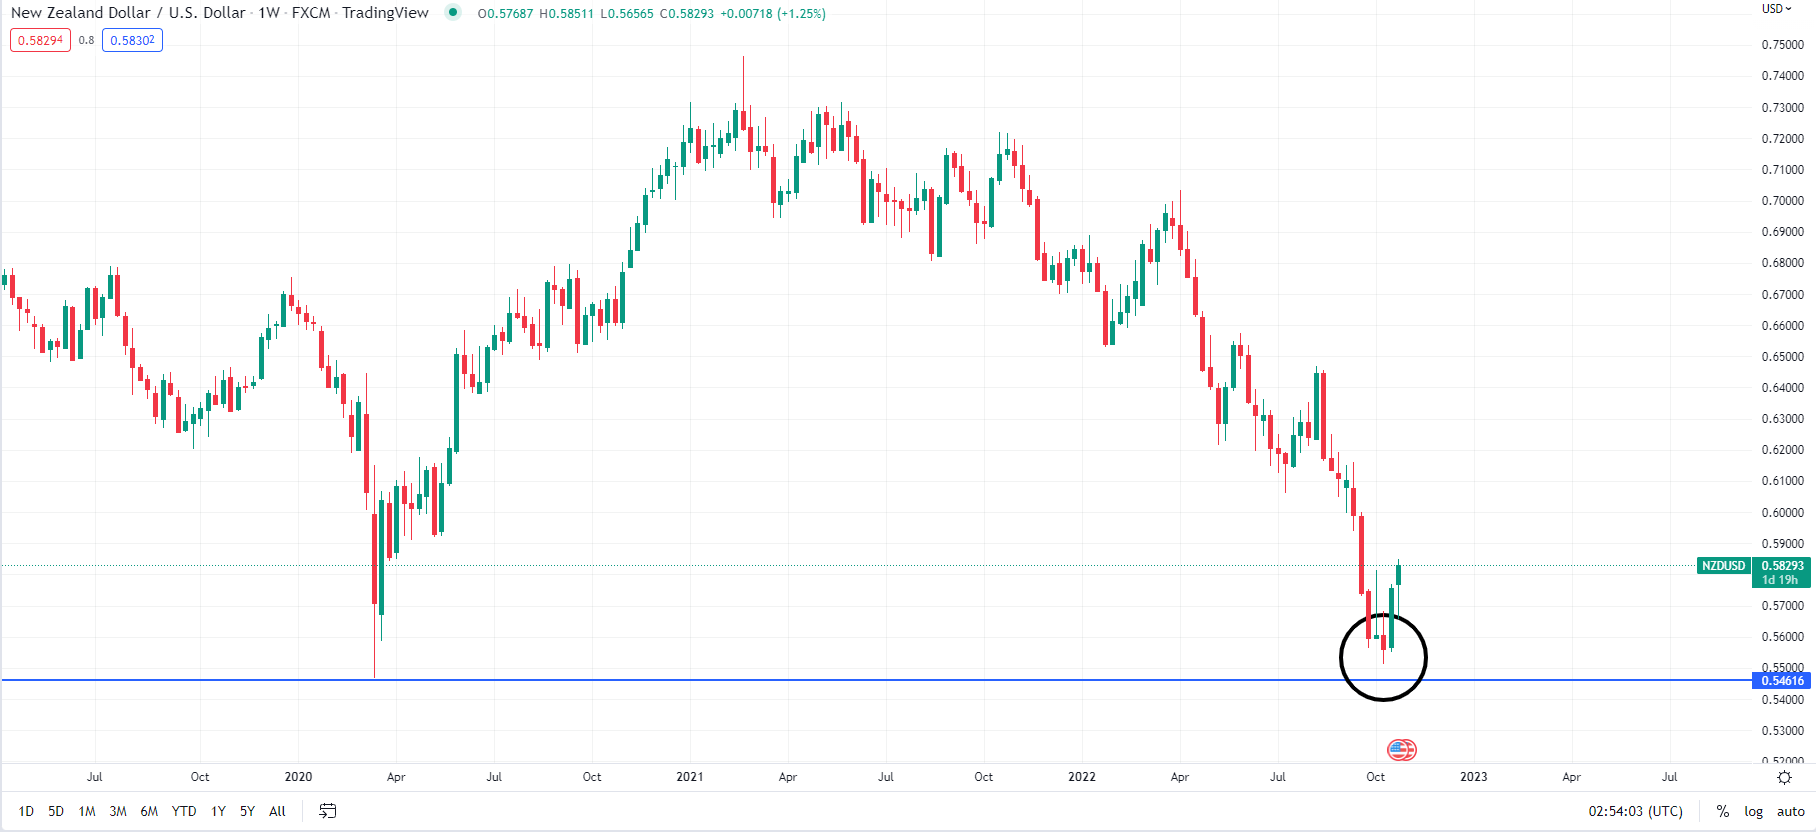
Chart Created Using TradingView
Beyond the short term, the medium-term bias for NZD/USD remains down. That’s because on the weekly and monthly charts, the Moving Average Convergence Divergence (MACD) indicator – a measure of trend and momentum – remains in negative territory, indicating a downtrend. Hence, any upside is likely to be limited. On the downside, there is strong support at Friday’s low of 0.5597. Any break below the support would raise the odds that NZD/USD had resumed its downtrend.

--- Written by Manish Jaradi, Strategist for DailyFX.com


