


NZD/USD, NEW ZEALAND DOLLAR - Technical Outlook:
- New Zealand Dollar’s rebound appears to be stalling.
- What are the signposts to watch ahead of the US FOMC meeting?
- NZD/USD’s medium-term downtrend remains intact.

NZD/USD SHORT-TERM TECHNICAL FORECAST – NEUTRAL
The New Zealand dollar’s three-week rebound appears to be stalling as it tests key resistance ahead of the crucial US Federal Reserve Open Market Committee meeting (rate decision is on Wednesday).
NZD/USD’s trend on intraday charts indicates that the trend remains up as it attempts to break above vital resistance at the October 6 high of 0.5815. This resistance is important as a decisive break above it could open the way towards 0.6000-0.6050 (including the 50% retracement of the August-October fall).
NZD/USD Daily Chart
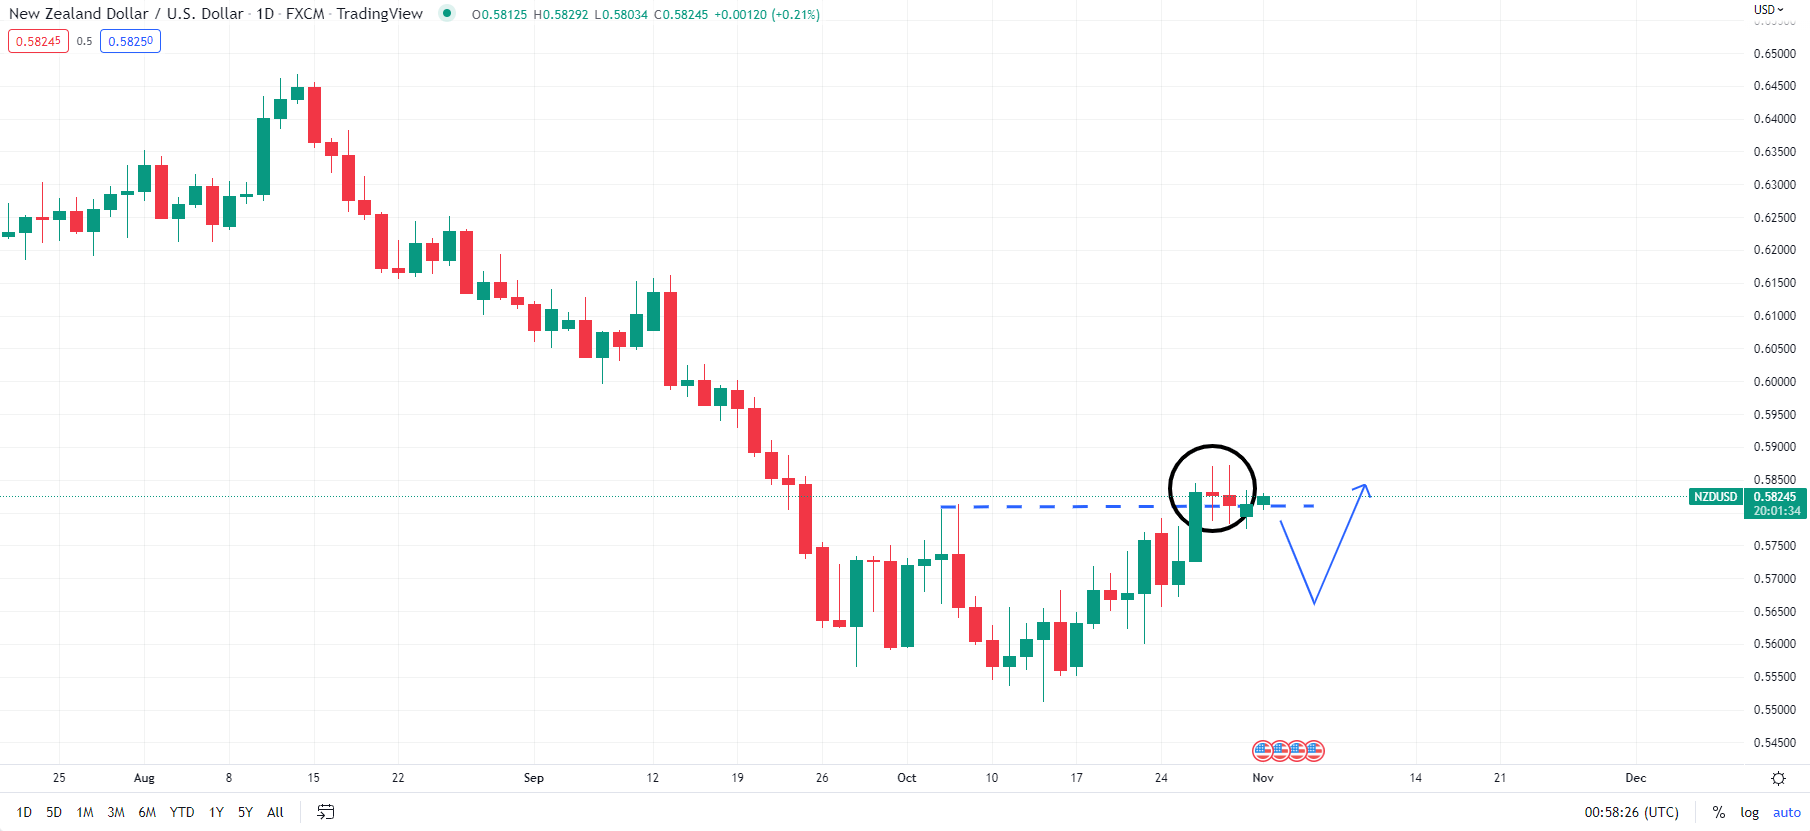
Chart Created Using TradingView
However, the back-to-back doji candlesticks on the daily charts reflect indecision as the pair tests the resistance, raising the risk of a minor retreat, especially if the US Fed doesn’t signal a slowdown in its aggressive monetary tightening cycle. The Fed is widely expected to hike by another 75 basis points after the conclusion of its two-day meeting tomorrow. Markets have been expecting a pivot in the monetary policy after minutes of the last Fed meeting in September stated that participants observed it would become appropriate at some point to slow the pace of rate increases.
To be sure, NZD/USD hasn’t broken any immediate support even on intraday charts. Hence it would be premature to conclude that a retreat is imminent. In this regard, a decisive break below 0.5770 would be a signal of a deeper retreat towards 0.5600-0.5650 (including the October 21 low and cloud support). The latter support is crucial, and a break below could be a signal of resumption of the medium-term decline – similar to the move in August (see chart).
NZD/USD 4-Hour Chart
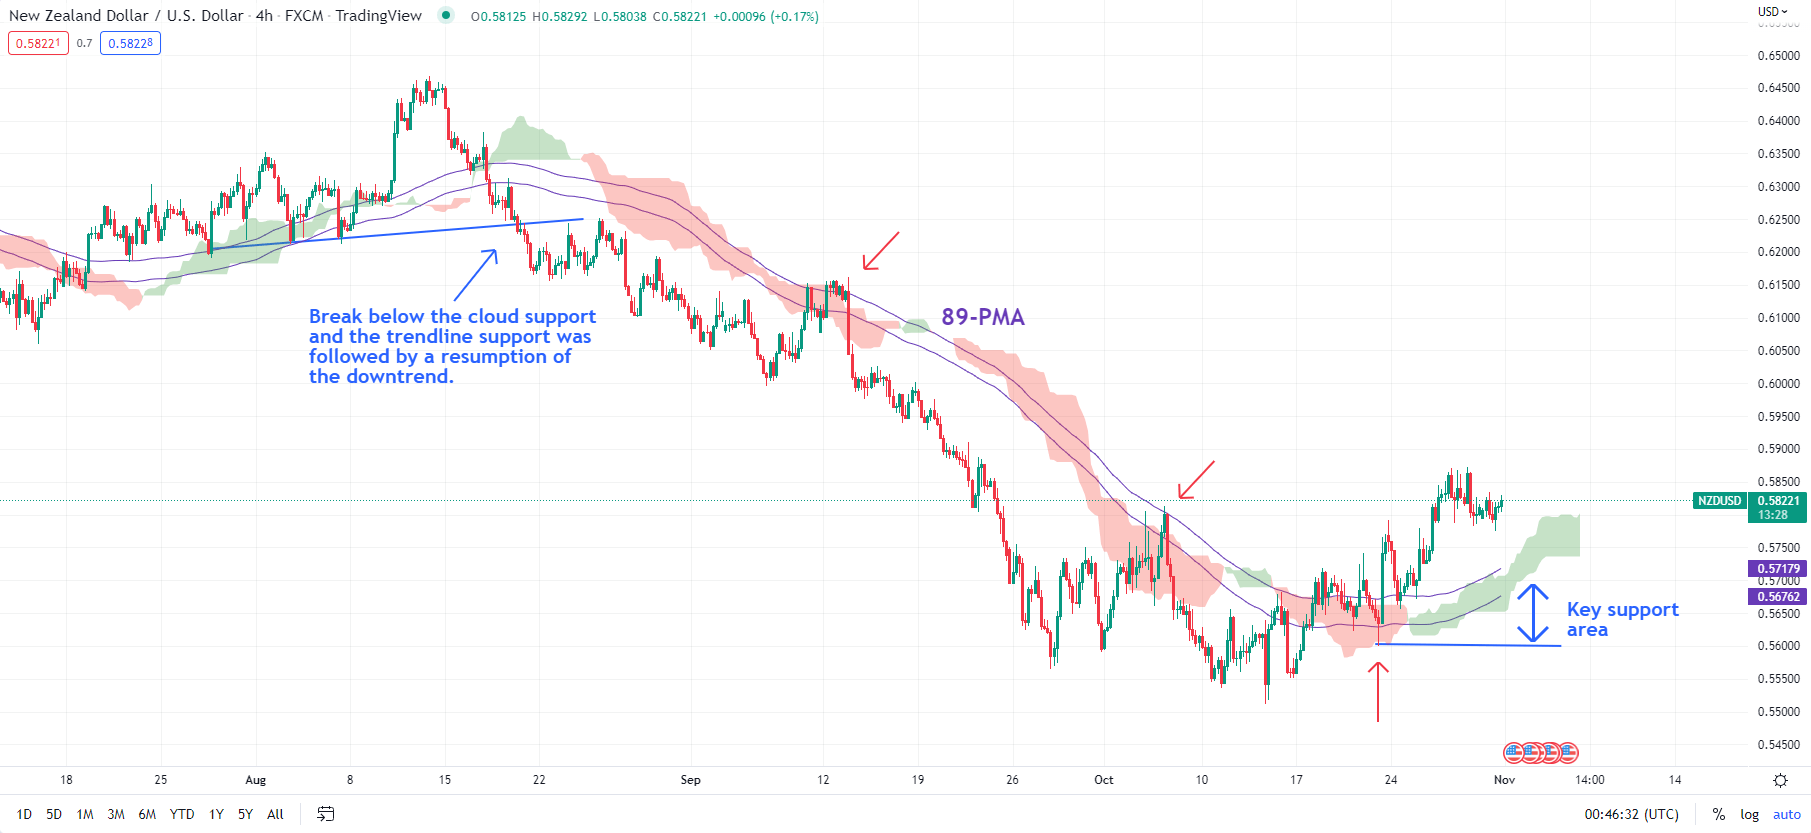
Chart Created Using TradingView
Beyond the short term, the medium-term bias for NZD/USD remains down. That’s because on the weekly and the monthly charts, the Moving Average Convergence Divergence indicator, a measure of trend and momentum, remains in negative territory, indicating a downtrend.

--- Written by Manish Jaradi, Strategist for DailyFX.com


