


NZD/USD, NEW ZEALAND DOLLAR - Technical Outlook:
- New Zealand Dollar has run into significant resistance.
- Beyond the short term, the odds are growing that the worst in NZD/USD could be over.
- What are the key levels to watch?

NZD/USD SHORT-TERM TECHNICAL FORECAST – NEUTRAL
The New Zealand dollar has run into significant resistance against the US dollar, raising the prospect of an extended range in the short term.
NZD/USD’s three-month-long rally appears to have stalled as it tests a strong converged barrier: the December high of around 0.6500, the 89-week moving average, slightly below the 200-week moving average. Earlier, the pair hit a 6-month high in December on subdued momentum – the 14-week Relative Strength Index was capped at around 60, similar to previous corrective rallies in the past (as the chart shows). Typically, readings above 60-65 increase the likelihood of a break above resistance.
NZD/USD Weekly Chart
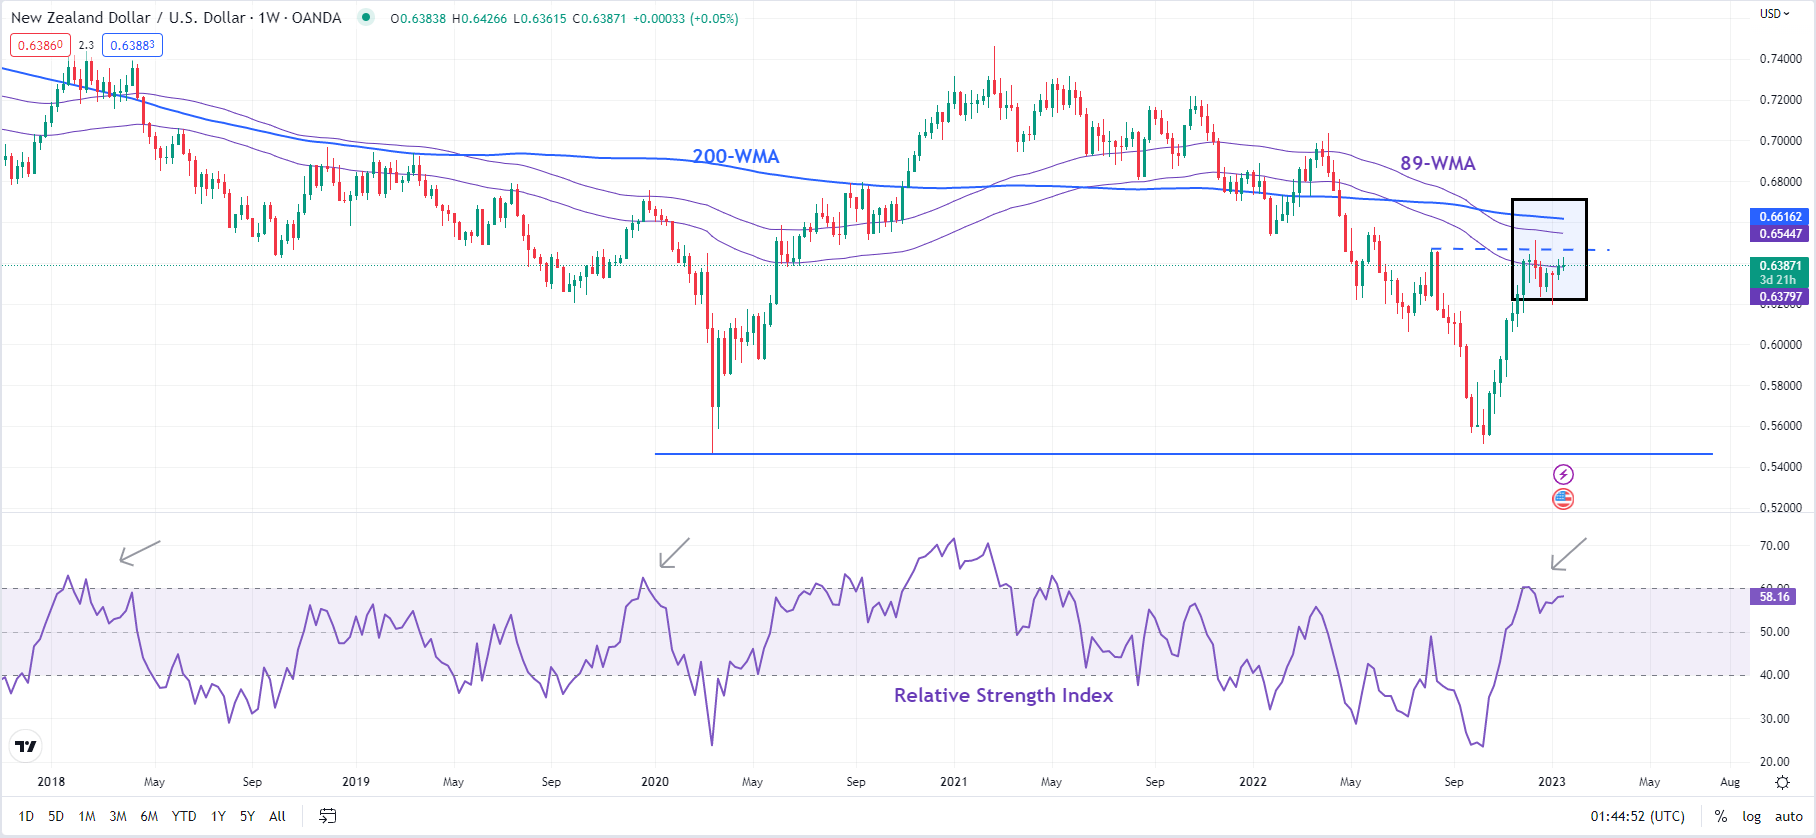
Chart Created Using TradingView
Given the pace and the extent of the rise since the end of 2022, the ranging scenario could continue in the near term. A narrower range would be 0.6150-0.6500, including the December high and the early-January low. A slightly wider range could be 0.6000-0.6600, including the 200-week moving average and the 50% retracement of the end-2022 rise.
NZD/USD Daily Chart
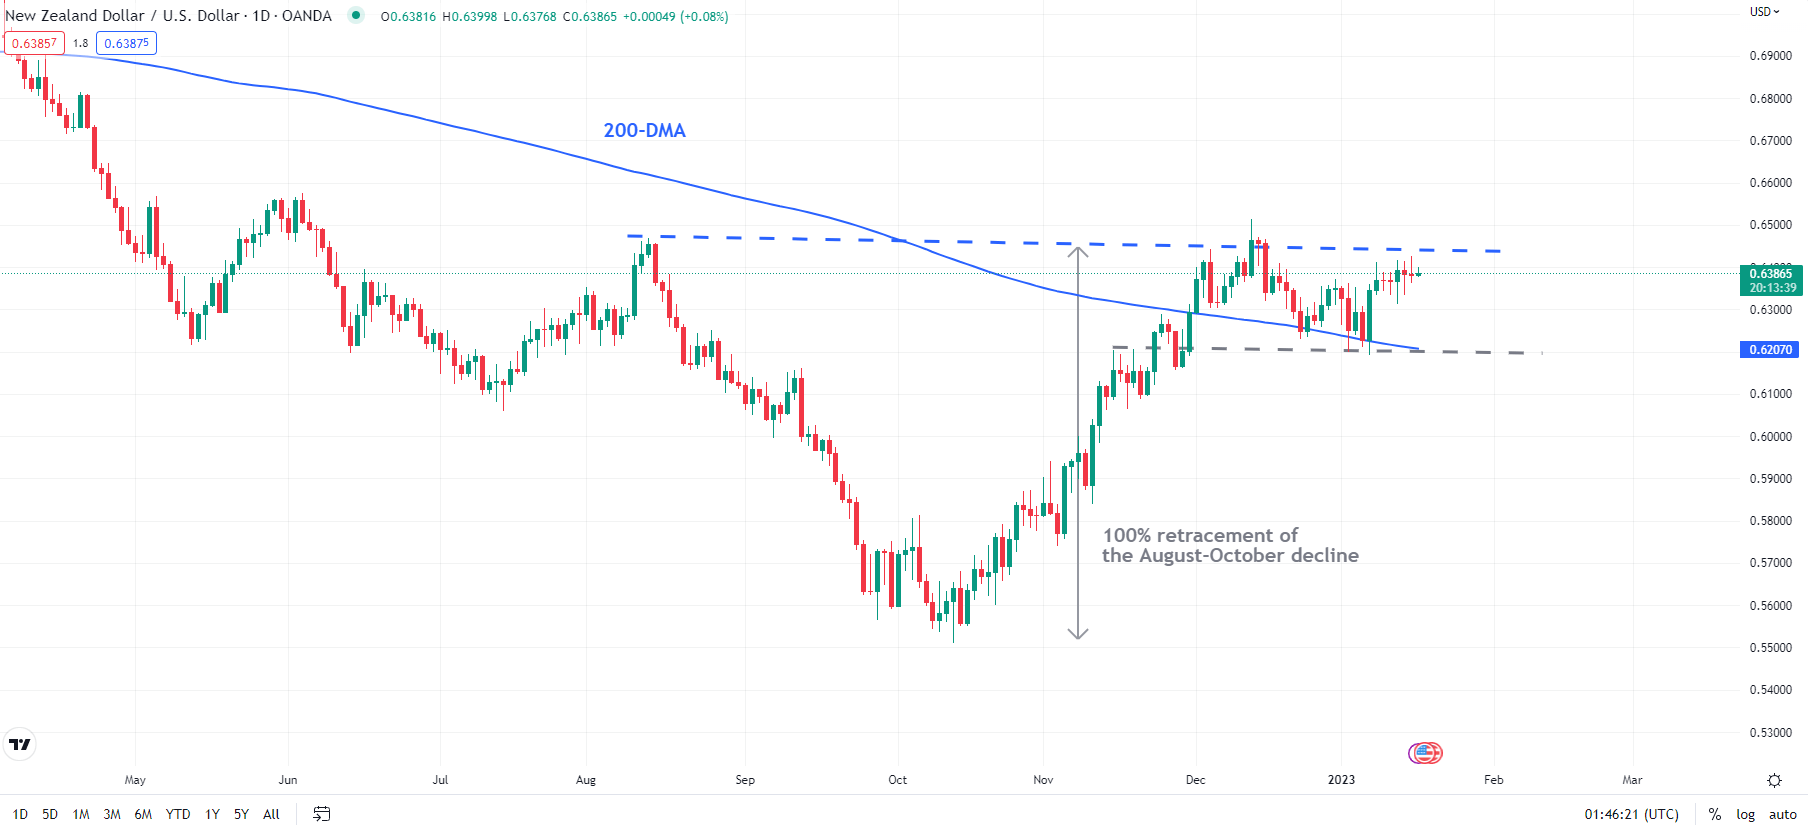
Chart Created Using TradingView
Looking beyond the near term, the odds are growing that the worst for NZD/USD could well be over after it held in October major support at the 2020 low of 0.5465. Furthermore, the subsequent rebound has been a 100% retracement of the August-October slide – the last ‘supply’ point. In general, when a market is able to fully retrace the last supply point, it tends to indicate exhaustion in selling pressure. The path of least resistance tends to be sideways to up in such scenarios.

--- Written by Manish Jaradi, Strategist for DailyFX.com


