


Japanese Yen, USD/JPY, Technical Analysis, Retail Trader Positioning – IGCS Update
- Japanese Yen depreciates after the Fed rate decision
- Retail traders kept unwinding USD/JPY bullish bets
- Will the exchange rate continue higher from here?

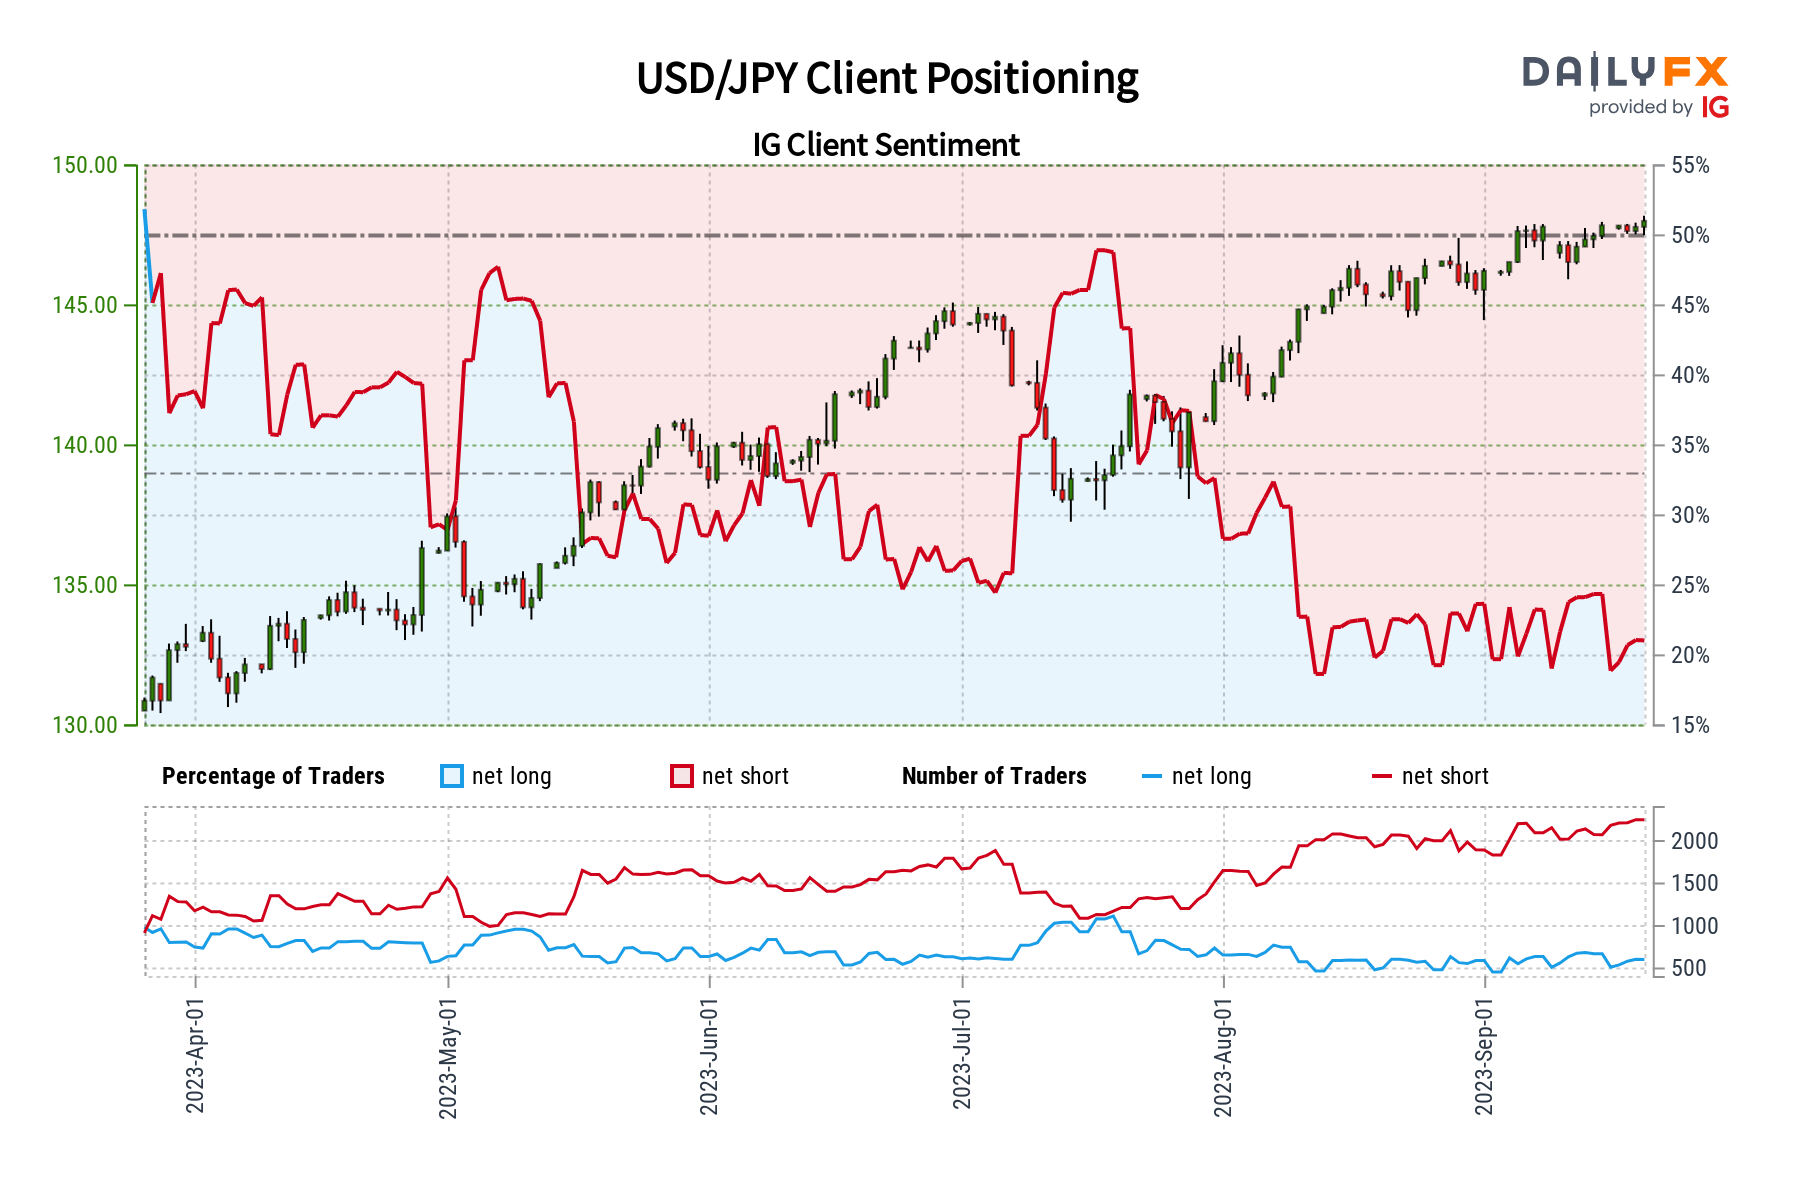
The Japanese Yen weakened against the US Dollar in the aftermath of the Federal Reserve interest rate decision, where Chair Jerome Powell alluded to a ‘higher for longer’ monetary policy approach. In response, retail traders have become less bullish about USD/JPY. This can be seen by taking a look at IG Client Sentiment (IGCS), which typically functions as a contrarian indicator.
USD/JPY Sentiment Outlook – Bullish
The IGCS gauge shows that about 38% of retail traders are net-long USD/JPY. Since most of them are biased to the downside, this hints that prices may continue higher down the road. This is as upside exposure decreased by -5% and -17% compared to yesterday and last week, respectively. With that in mind, the combination of overall positioning and recent changes offers a stronger bullish bias.
| Change in | Longs | Shorts | OI |
| Daily | -4% | 6% | 3% |
| Weekly | 45% | -12% | 0% |
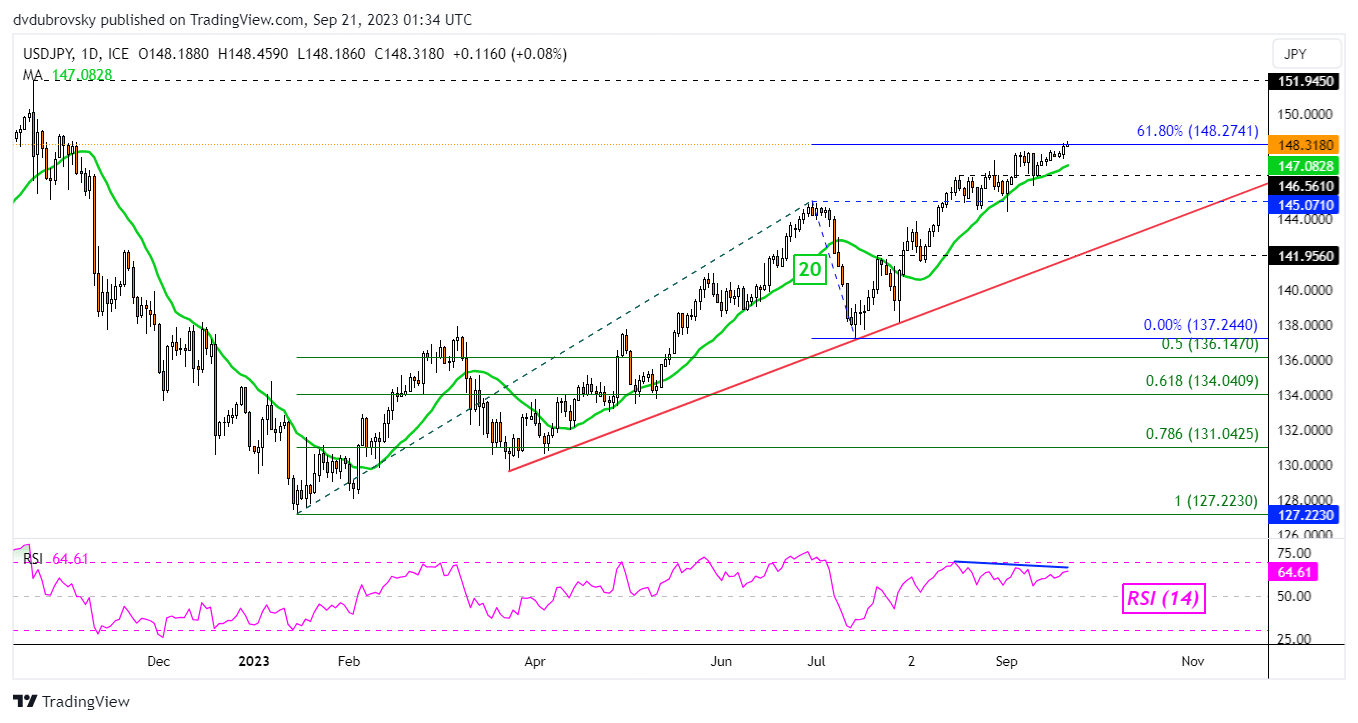
Japanese Yen Daily Chart
Looking at the daily chart, USD/JPY is flirting with attempting a break above the 61.8% Fibonacci extension level at 148.27. That said, negative RSI divergence is present. This shows that upside momentum is fading, which can at times precede a turn lower. That would place the focus on the 20-day Moving Average, which is immediate support.
That said, the broader bullish bias is being maintained by rising support from March. As such, it would take an extended move lower to overturn the bullish bias. Clearing higher exposes last year’s high of 151.94.

--- Written by Daniel Dubrovsky, Senior Strategist for DailyFX.com


