


Gold, Retail Trader Positioning, Technical Analysis – IGCS Update
- Gold prices aiming for best week since mid-July
- Yet, outlook remains bearish based on retail bets
- What are key technical levels to watch ahead?

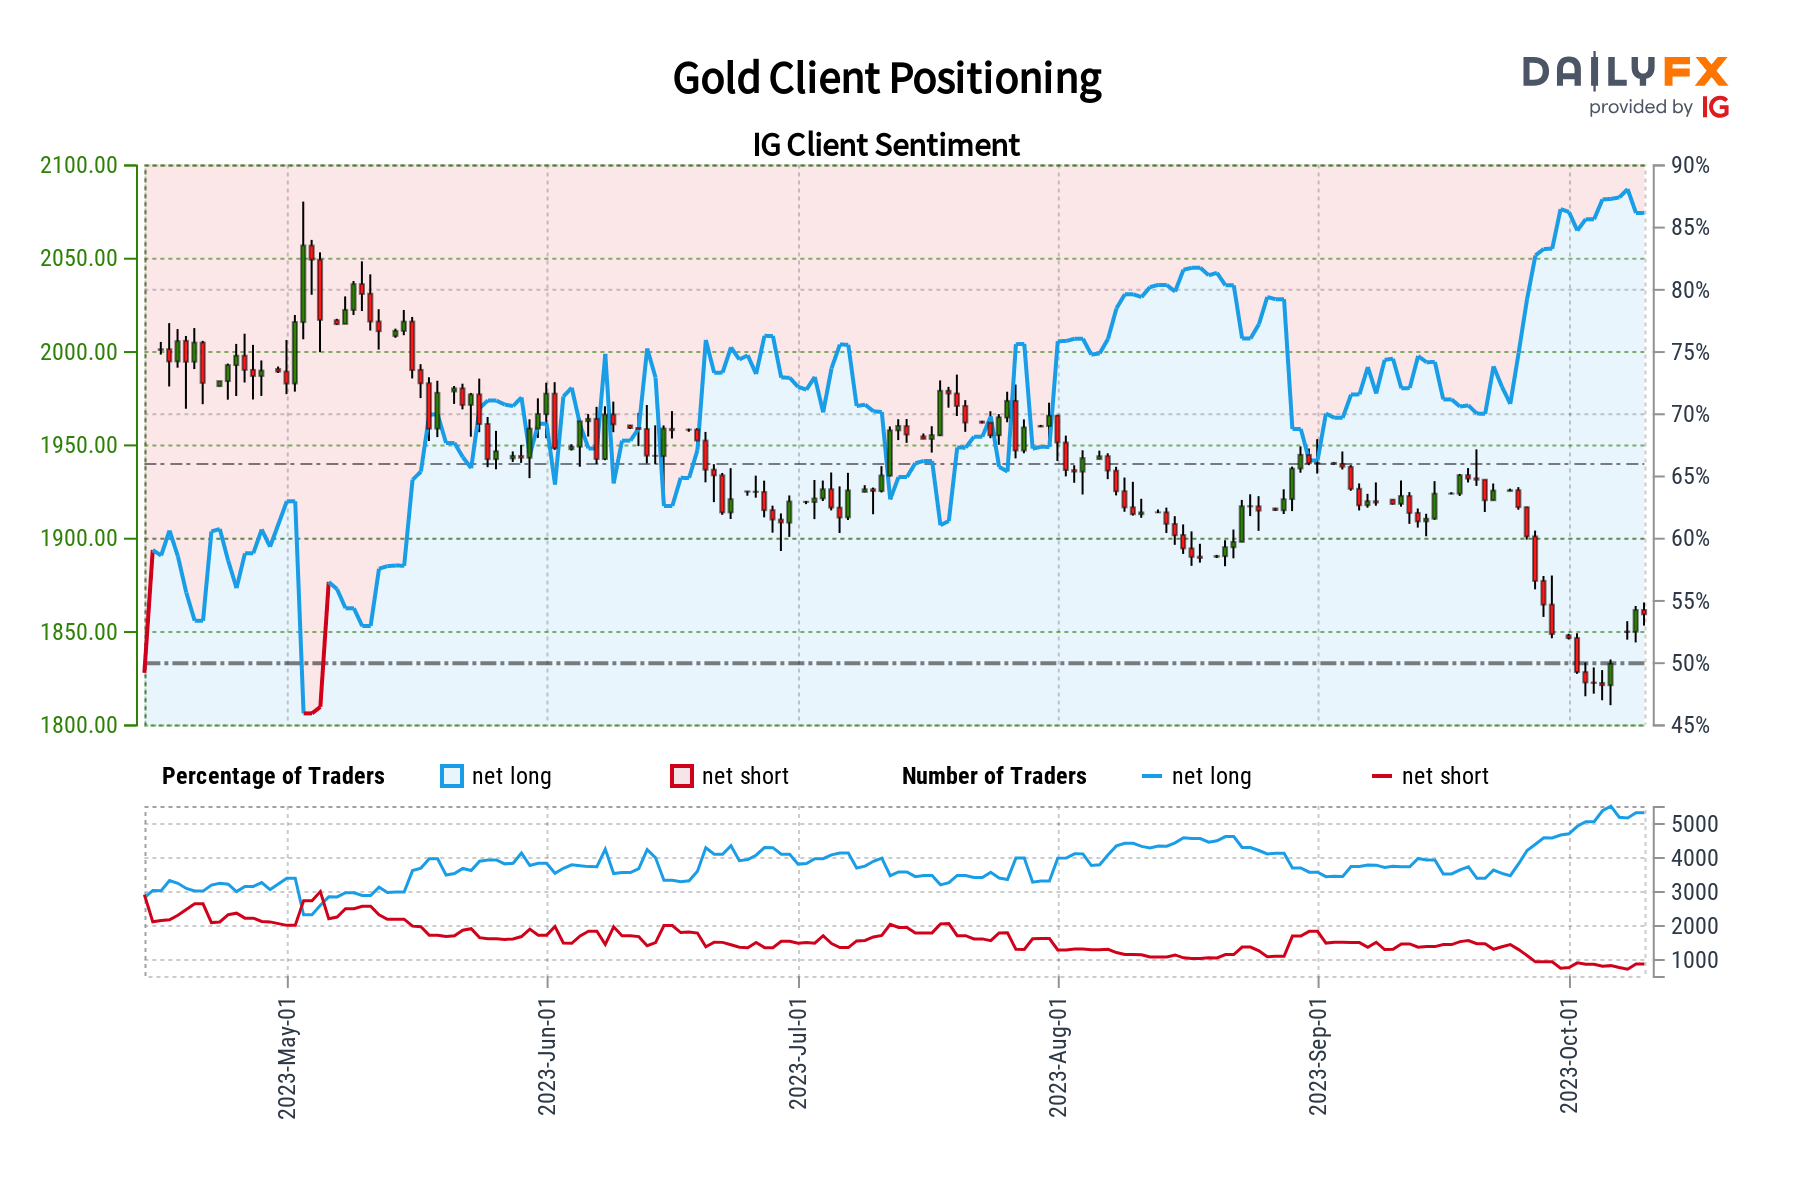
At +1.5%, gold prices are so far on course for the best week since the middle of July. Yet, despite recent gains, retail traders have not been increasing their downside exposure as one would usually expect. This can be seen by looking at IG Client Sentiment (IGCS), which usually functions as a contrarian indicator. In fact, as we are about to see, the outlook is seemingly not looking rosy.
Gold Sentiment Outlook - Bearish
The IGCS gauge shows that about 86% of retail traders are net-long gold. Since the vast majority are biased to the upside, this continues to hint that prices may fall down the road. Despite recent gains, upside exposure has increased by almost 8% compared to a week ago. This is as downside bets increased by 5.45% over the same period. The combination of overall positioning and recent changes continues to produce a bearish contrarian trading bias outlook.
| Change in | Longs | Shorts | OI |
| Daily | -2% | 1% | 0% |
| Weekly | -1% | 5% | 1% |
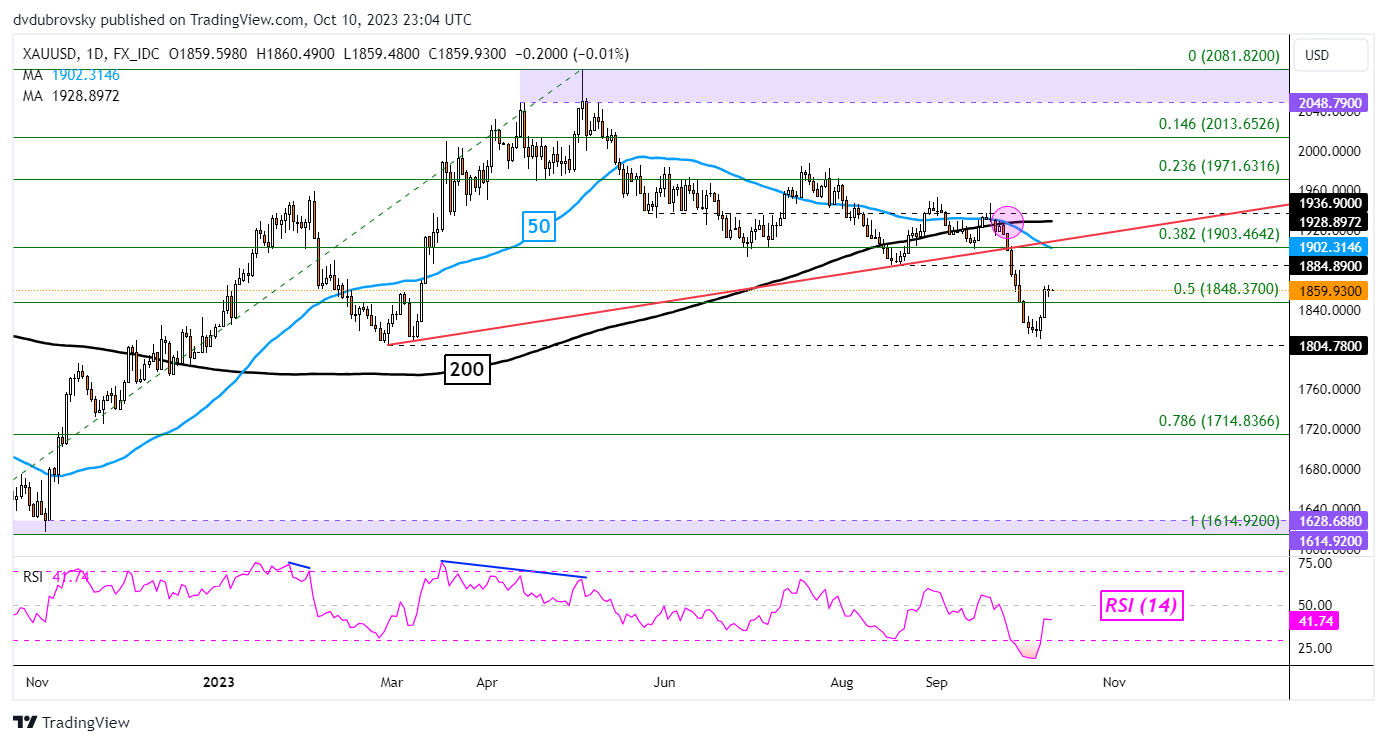
XAU/USD Daily Chart
On the daily chart, gold has pushed back above the midpoint of the Fibonacci retracement level of 1848.37. Further upside confirmation has been lackluster. Further to the point, a bearish Death Cross emerged between the 200- and 50-day moving averages not long ago after prices broke under key rising support from February.
As such, the overall technical posture remains bearish biased for the yellow metal. Further upside progress is needed to overturn this outlook. Immediate resistance seems to be the 1884.89 inflection point, followed by the 50-day moving average. In the event of a turn lower, keep a close eye on the February low of 1804.78.

-- Written by Daniel Dubrovsky, Senior Strategist for DailyFX.com


