


Gold, XAU/USD, Silver, XAG/USD - Technical Outlook:
- Gold could be settling in a range in the short term.
- Minor technical break lower in Silver.
- What are the key levels to watch?

GOLD TECHNICAL OUTLOOK - BULLISH
The sharp retreat toward the end of last week is a sign that gold’s three-month-long-uptrend has stalled for now and the yellow metal could settle in a range in the short term.
On the weekly candlestick charts, XAU/USD posted a bearish reversal candle last week. This follows back-to-back doji candles on the weekly charts, indicating that bulls are exhausted for now. Furthermore, the break below minor support at the mid-January low of 1896 has confirmed that the upward pressure has faded for now (refer to the previous article that highlighted the risk).
XAU/USD 4-Hour Chart
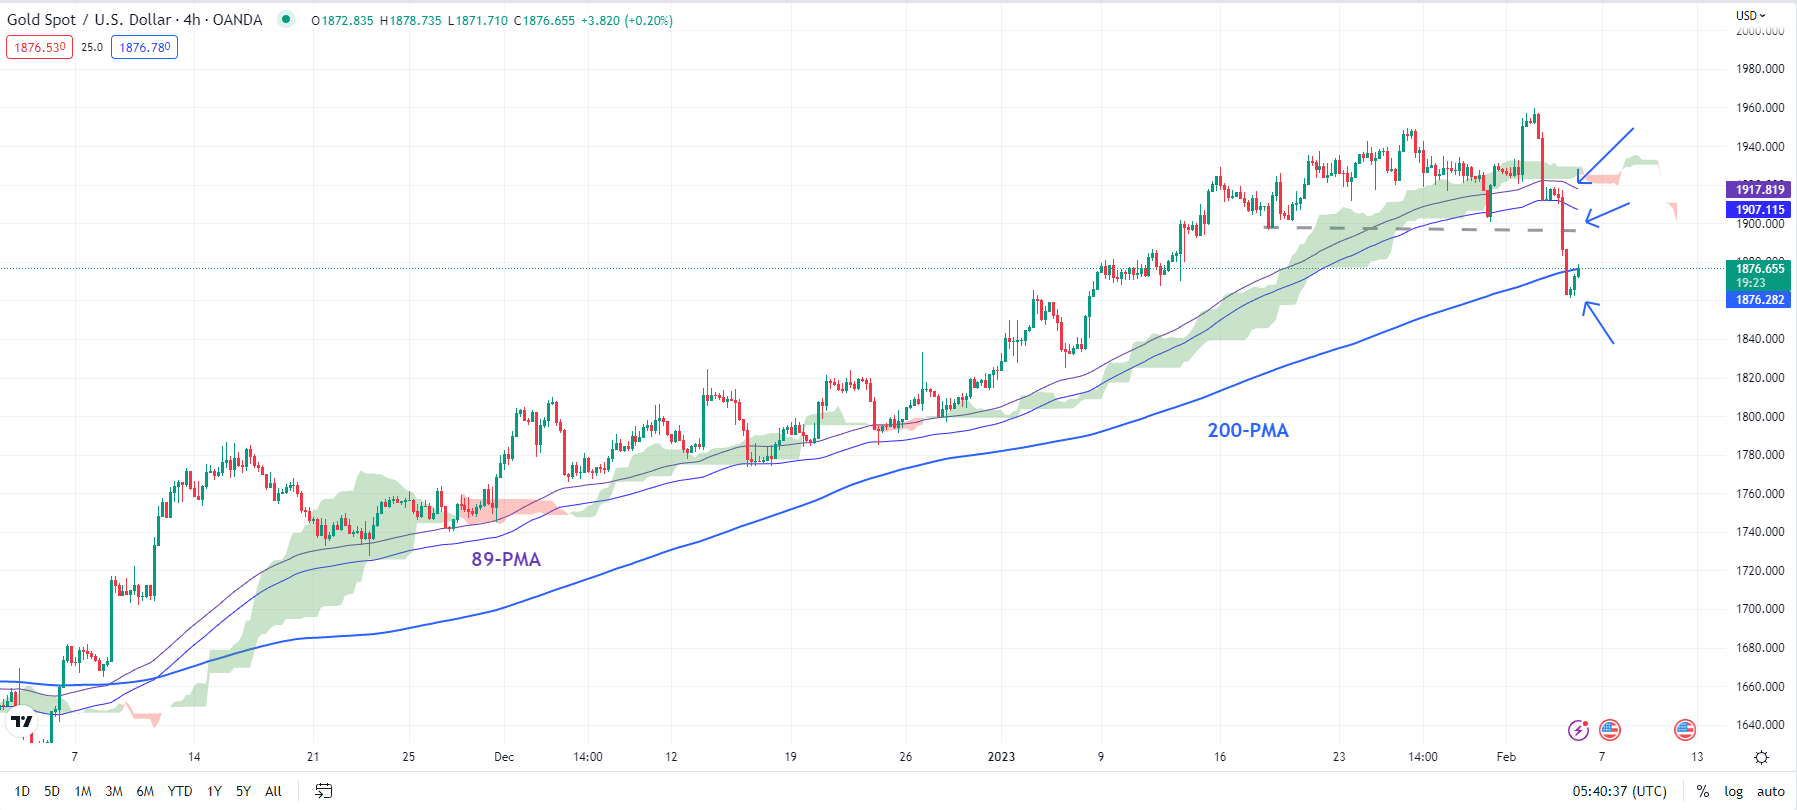
Chart Created Using TradingView
To be sure, it doesn’t imply that the uptrend has ended, but XAU/USD could go sideways over the next week or two. In this regard, there is immediate support at 1876 (including the 200-period moving average on the 4-hourly chart), which could cushion the downside. On the upside, the yellow metal faces a critical barrier at 1910 (the 50% retracement of last week’s range). Gold would need to rise above the ceiling for the immediate downside risks to ease.
XAU/USD Daily Chart
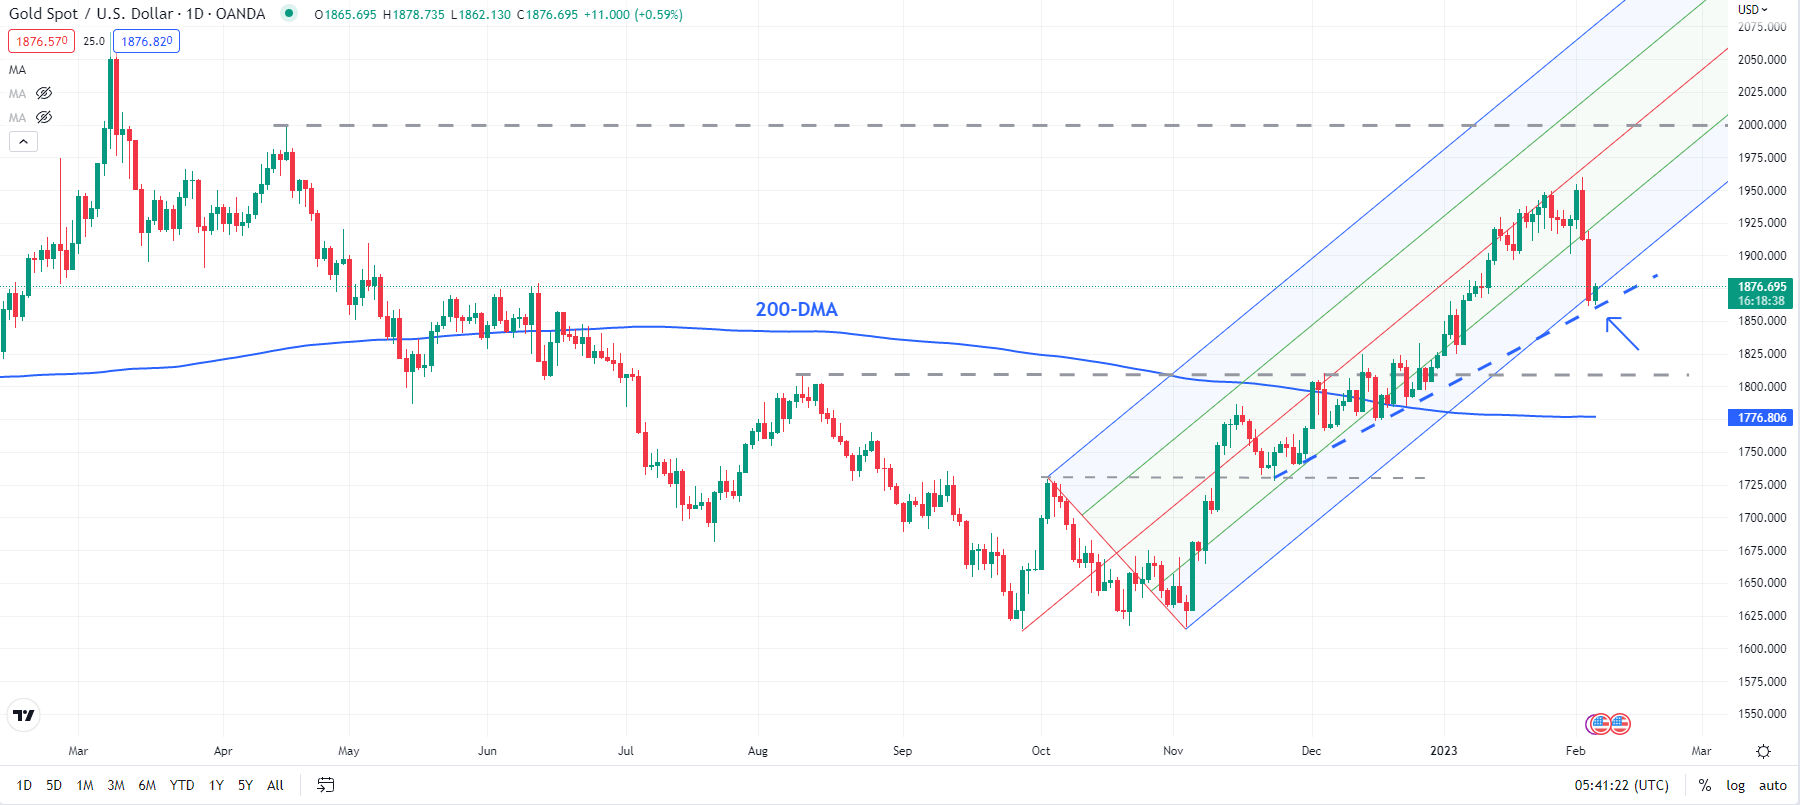
Chart Created Using TradingView
SILVER TECHNICAL OUTLOOK - NEUTRAL
Silver’s breakdown out of a month-long sideways range is a sign that cracks are developing in the three-month-long rally. XAG/USD dropped below an immediate floor on a horizontal trendline from early January at about 23.10. The break has paved the way toward the mid-December low of 22.50, roughly the price objective of the sideways topping pattern (refer to last week’s update highlighting the risk).
XAG/USD Daily Chart
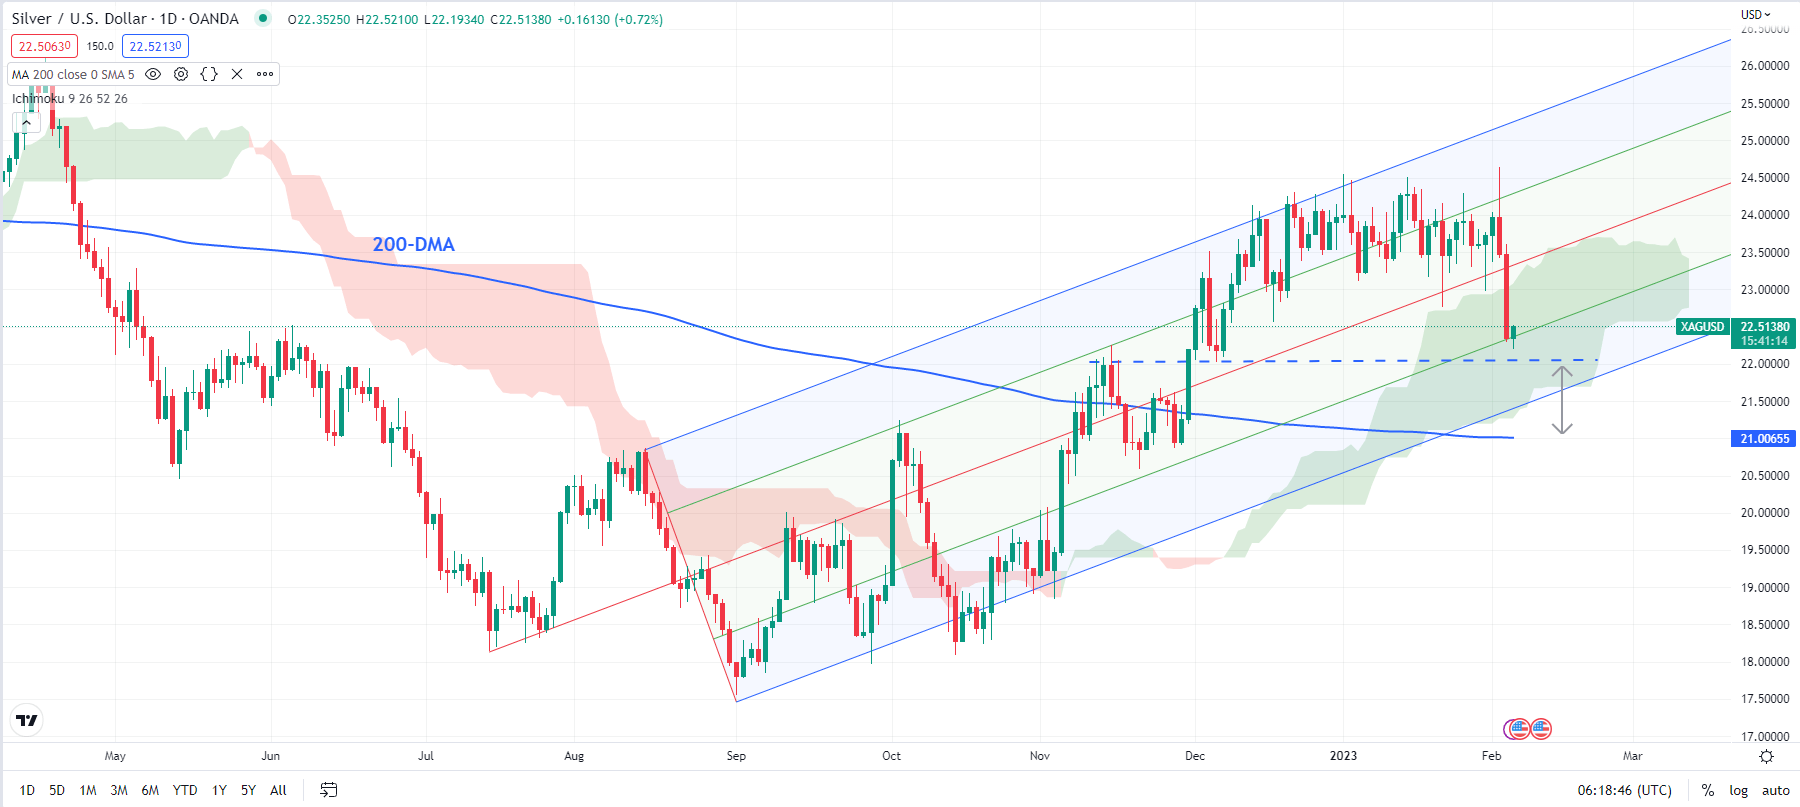
Chart Created Using TradingView
On intraday charts, the trend is unambiguously bearish. However, on the daily chart, the trend is at best sideways with a slight downward bias, unless XAG/USD falls below the vital cushion zone at 21.00-22.00 (including the 200-day moving average). However, what is not clear is whether Silver has some more immediate downside. In this regard, it would need to break above 23.00 for the imminent downside risks to fade.
--- Written by Manish Jaradi, Strategist for DailyFX.com


