


KEY POINTS:
- XAU/USD Technical Outlook: Neutral.
- XAG/USD Technical Outlook: Neutral.
- XAU/USD Potential Shooting Star Candlestick Close Hints at Deeper Retracement.
- XAG/USD Weekly Price Action Prints a New High. Time for a Retracement?

Most Read: Gold Remains Vulnerable Below $1800 Key Level and 200-Day MA
GOLD AND SILVER WEEK IN REVIEW
Gold started the week in buoyant mood before finding resistance at the $1786 level just shy of the August highs resting above the $1800 handle. The precious metal has since entered a phase of consolidation as hawkish rhetoric from Federal Reserve policymakers and caution around the US dollar has capped any significant moves in either direction. The struggles of the dollar index have kept any significant retracement at bay for now with further upside facing a host of technical and fundamental hurdles. Silver is facing similar challenges likely to close the week in the red following an impressive two-week rally. Gold and Silver moves will likely be driven by the dollar index as well as broader market sentiment.

XAU/USD TECHNICAL OUTLOOK
XAU/USD D Chart
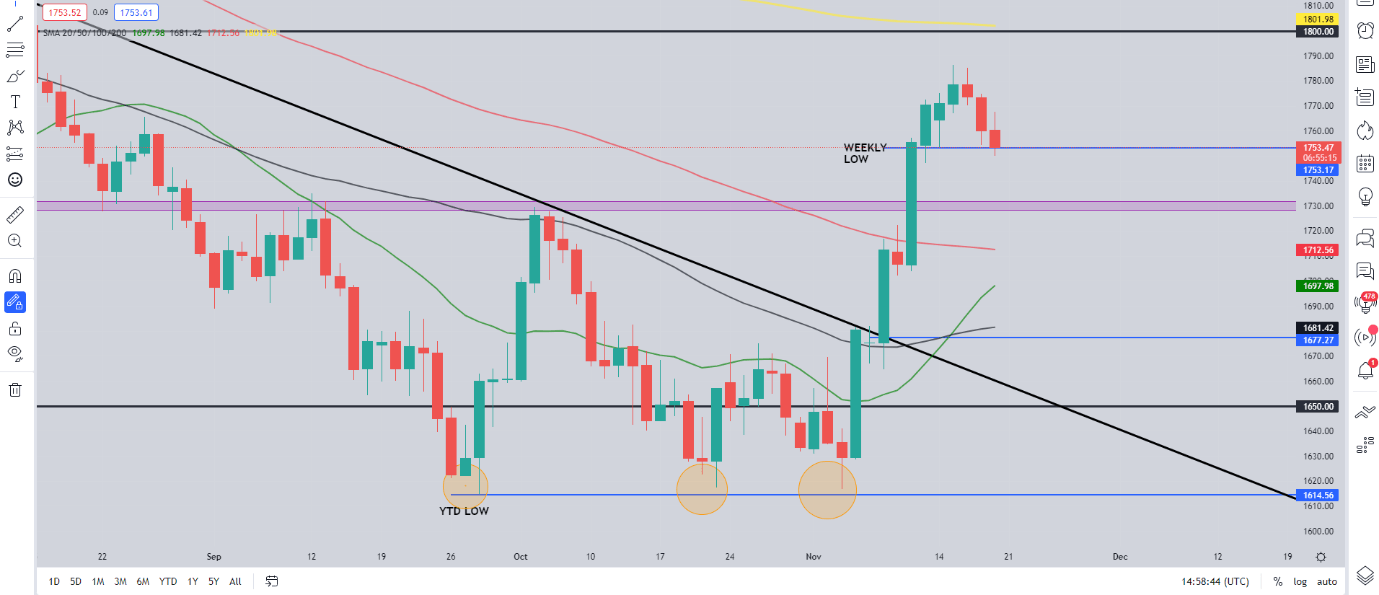
Source: TradingView, prepared by Zain Vawda
Looking at the bigger picture, the overall downtrend on gold for 2022 has been broken while a significant resistance area around the $1730 level (September and October highs) where price had previously printed a double-top pattern has been cleared as well. The weekly looks on course for a shooting star candlestick close hinting at further downside in the week ahead.
On the daily chart above the 200-day MA lines up with the $1800 level which has yet to be tested. Gold has traded below the 200-day MA since June with it likely to provide a significant test for bulls should the precious metal break to the upside during the course of the week. As mentioned earlier any significant move is likely to be impacted by the dollar index. Should the new week start with the dollar on the back foot there is a real chance that price could rally toward the $1800 dollar level before finding resistance with the 200-day MA.
XAU/USD Four-Hour Chart
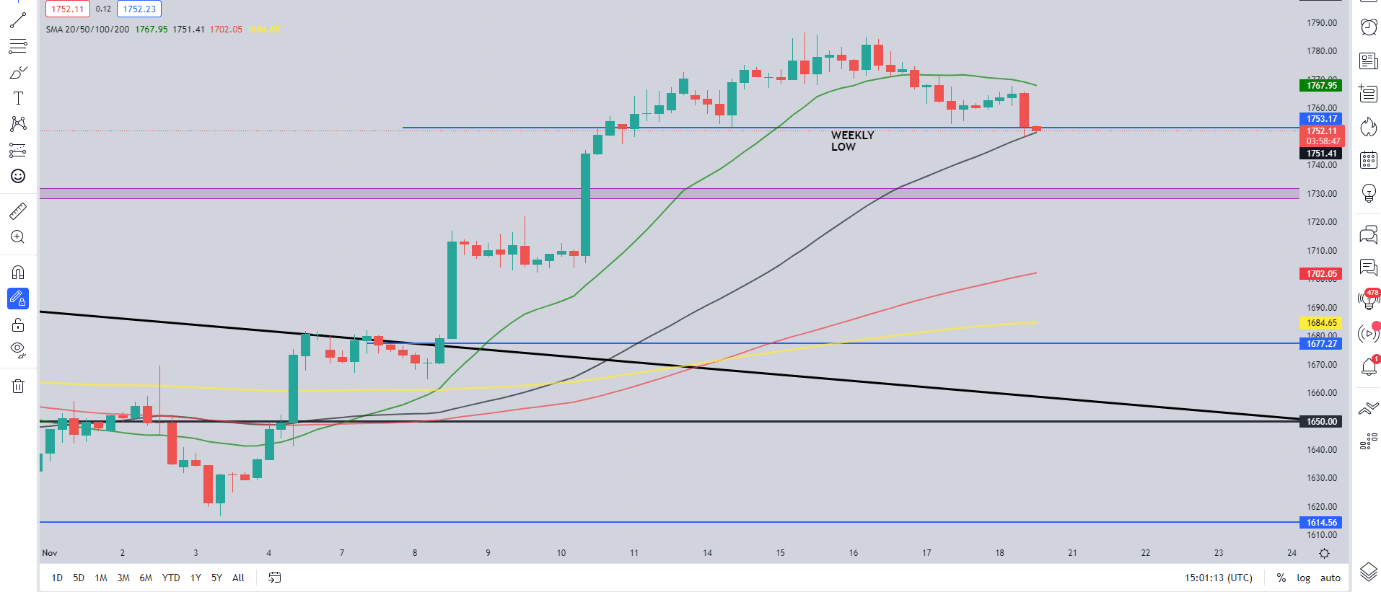
Source: TradingView, prepared by Zain Vawda
The 4H chart provides further evidence of the rangebound nature during the course of the week. The weekly low around $1753 served as significant support during the week keeping the bullish trend alive for the moment. A 4H candle close below this level will be the first sign of a change in structure as gold would have printed a new lower low. This break could open up a retest of aforementioned $1730 level (September and October highs).
Introduction to Technical Analysis
Time Frame Analysis
Recommended by Zain Vawda
XAG/USD Technical Outlook
XAG/USD Weekly Chart
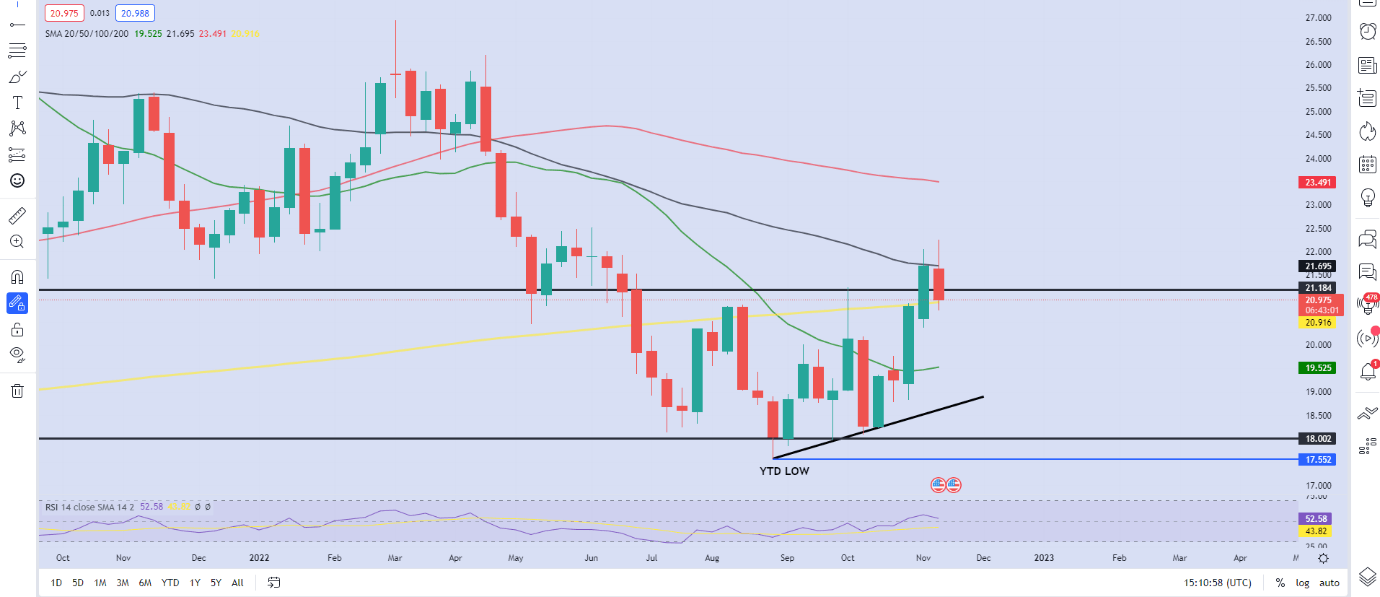
Source: TradingView, prepared by Zain Vawda
From a technical perspective, Silver has seen a rejection of the 50-day MA for the second week in a row while price is currently testing the 200-day MA. The pair remains on course for a bearish weekly close which could result in further downside to start the new week. Price action remains bullish on the weekly with the pair printing higher highs and higher lows since bouncing from its YTD low at the end of August.
XAG/USD Four-Hour Chart
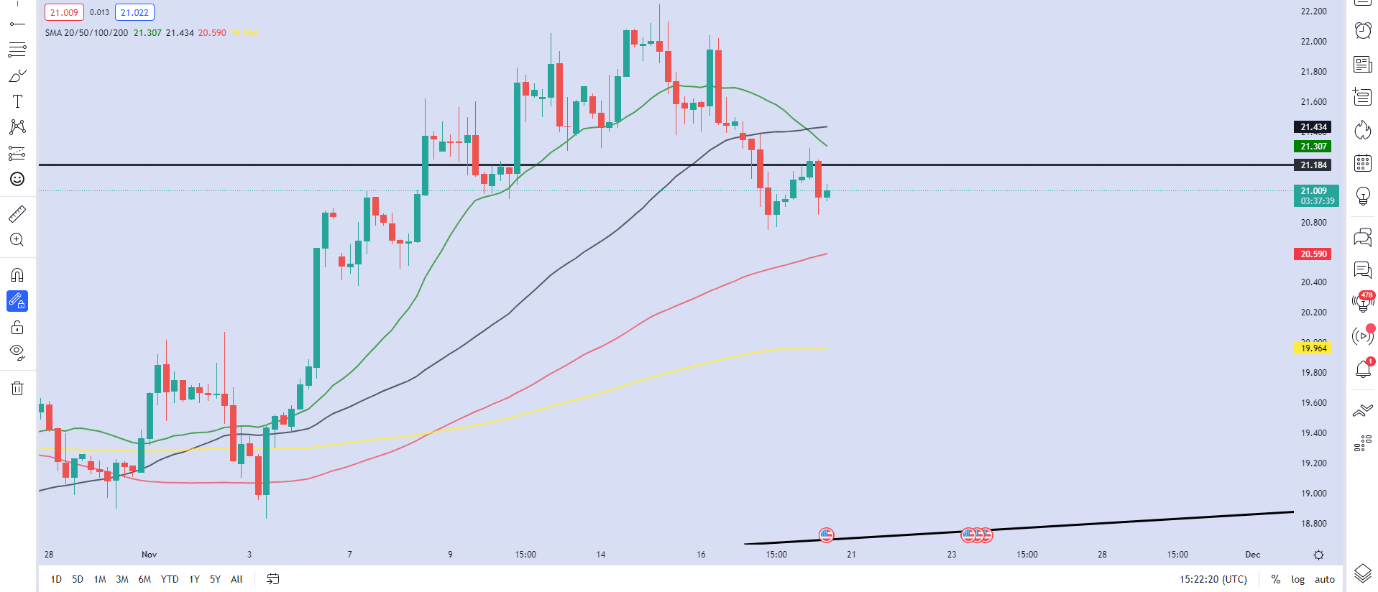
Source: TradingView, prepared by Zain Vawda
The daily and four-hour timeframe have already seen a shift toward bearish price action with the four-hour in particular printing a series of lower highs and lower lows as evidenced above. Should this continue and the daily follow suit silver could be in for a deep retracement back toward the psychological $20.00 level which lines up with the 200-day MA.
--- Written by Zain Vawda for DailyFX.com
Contact and follow Zain on Twitter: @zvawda


