


Gold, Silver, Trendlines – Technical Update:
- Gold and silver prices pressured by the Fed rate decision
- Gold turning lower toward key rising support
- Silver following same path, will a breakout occur?

XAU/USD Analysis
Gold and silver prices have turned lower in the aftermath of the Federal Reserve monetary policy announcement. There, Chair Jerome Powell basically alluded to a ‘higher for longer’ approach, causing financial markets to price in a higher terminal Federal Funds rate and pushing back expectations of rate cuts further down the time horizon.
In response, Treasury yields and the US Dollar rose, working together to pressure precious metals, like gold and silver, lower. On the daily chart below, XAU/USD rejected a recently formed, near-term falling trendline from July. That has opened the door to revisiting rising support from April, which is closely aligned with the 38.2% Fibonacci retracement level of 1903.46.
Clearing under the latter would open the door to a stronger bearish technical bias. Otherwise, pushing above near-term falling resistance exposes the 23.6% level of 1971.63.
| Change in | Longs | Shorts | OI |
| Daily | -7% | 10% | 0% |
| Weekly | -3% | 9% | 2% |
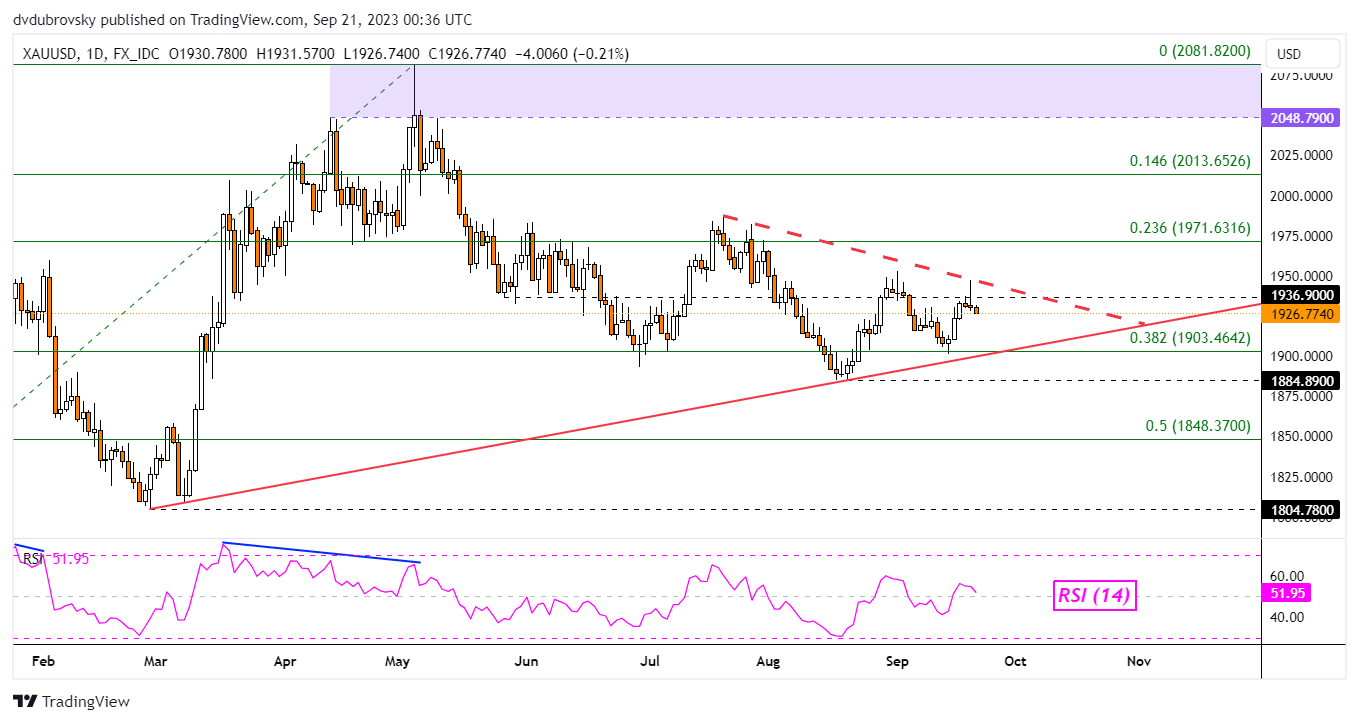
Chart Created in TradingView
XAG/USD Analysis
Meanwhile, silver faces a similar predicament in the wake of the Fed. Higher borrowing costs for longer and a stronger Greenback will likely pressure XAG/USD.
On the daily chart, silver can be seen turning back lower towards the rising range of support from August. Broadly speaking, XAG/USD has been consolidating between this rising support and a range of falling resistance from May.
As such, the broader technical outlook remains neutral. But, the fundamental consequences of the Fed on silver could open the door to an extended move lower. As such, keep a close eye on rising support. Breaking lower exposes the 78.6% Fibonacci retracement level of 21.24.
| Change in | Longs | Shorts | OI |
| Daily | -5% | 12% | -1% |
| Weekly | 0% | 21% | 4% |
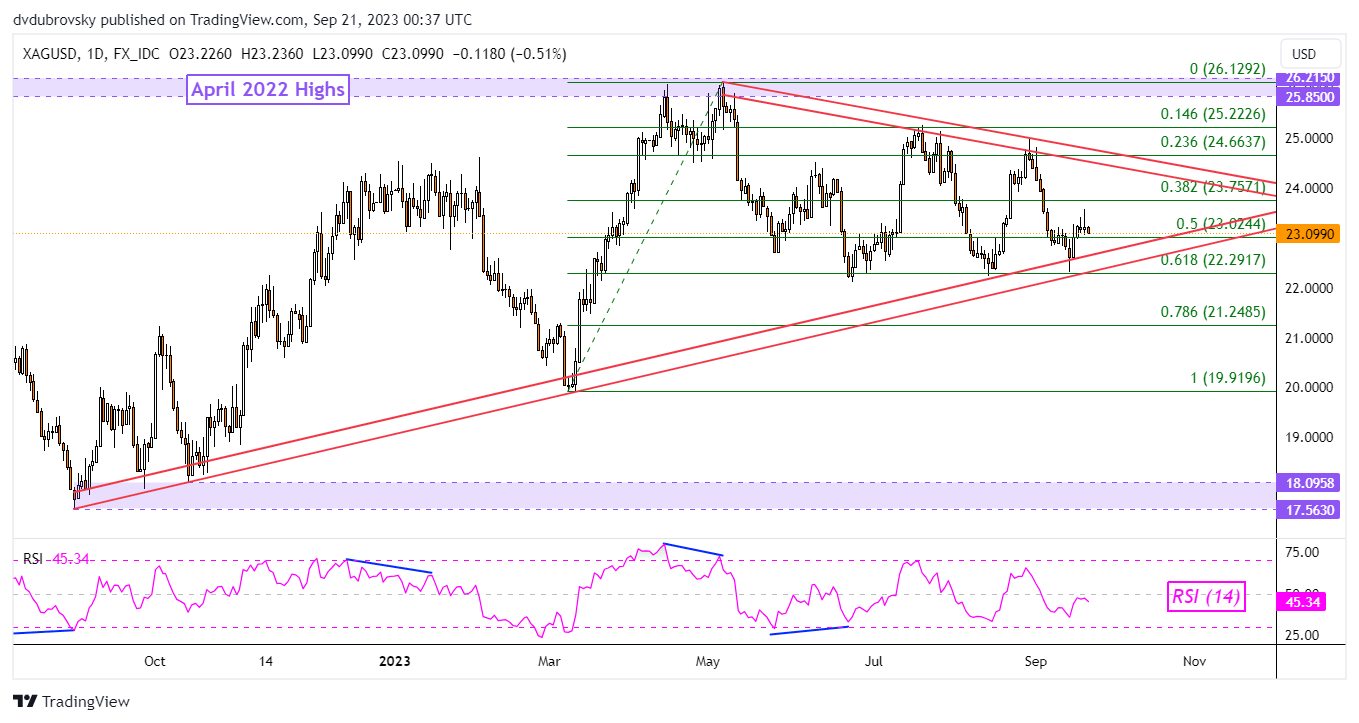
Chart Created in TradingView
--- Written by Daniel Dubrovsky, Strategist for DailyFX.com


