


GBP/USD Technical Outlook
- Cable flushed the 1985 low and recovered back to the point of panic origination
- Now the outlook gets a little more complicated as volatility likely to bring two-way trade

GBP/USD Technical Analysis: Flushed and Reversed, Now What?
The panic we saw in cable from Friday thru early Sunday trade took it down below the 1985 low and flushed it in convincing fashion. The recovery bounce unfolded in the manner which I outlined earlier this week – pullback, higher-low, then rip again to take back the panic-portion of the down-move, which meant back to the 11200s.
That sequence is a fairly common one in these types of panicky situations. But now that that is out of the way, now what? Things will get a little dicey from here and first and foremost we will need to keep an open mind about how this could play out.
It will likely be a lot of volatile two-way trade as we are already seeing with price having come off a couple hundred pips from the overnight high. With that in mind, there are some levels to watch now that this week is mostly in the rear-view mirror.
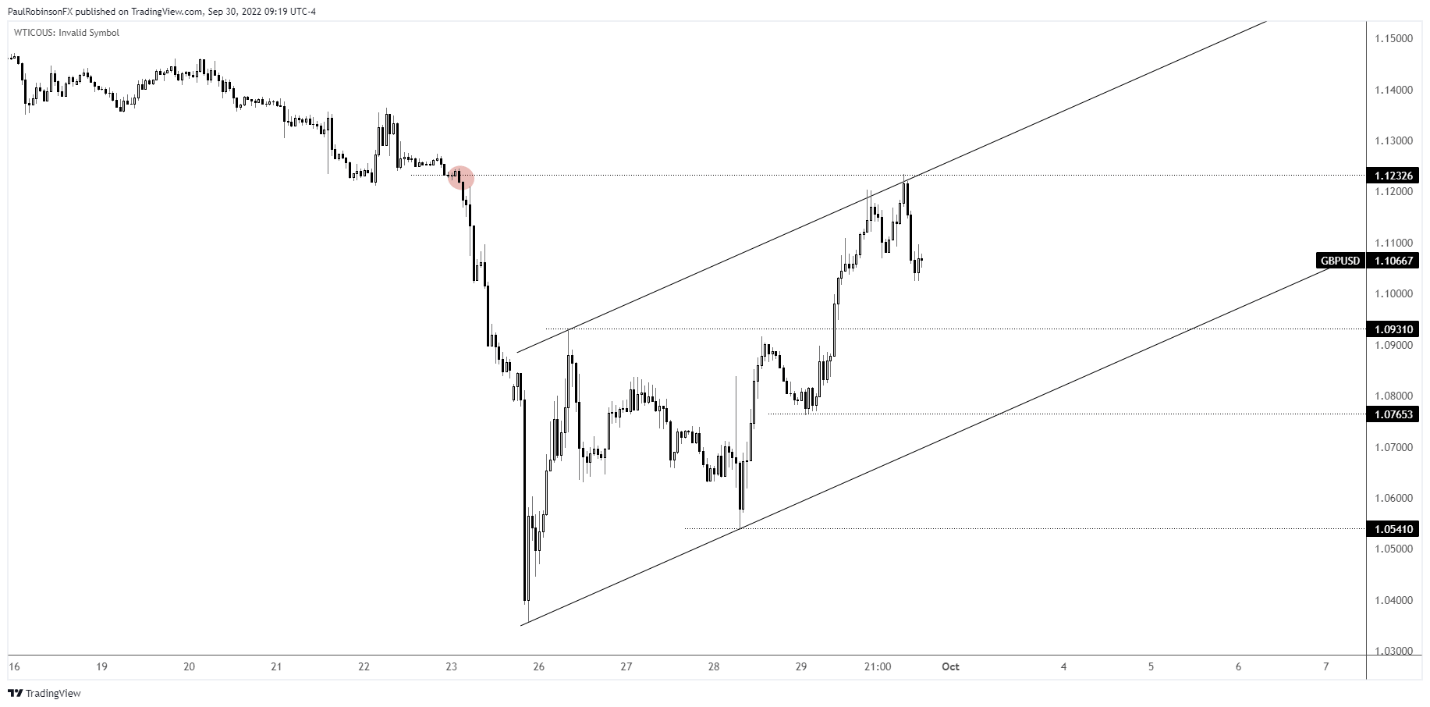
The high at 11234 will become resistance, which happened to be extremely close to the exact breakdown point prior to the panic portion of the trade. This becomes an important short-term high. If cable can manage to climb above, and the thinking is down before up, but if it can then the 2020 panic low at 11409 will be up next as substantial resistance.
On the down-side, we have the high of the initial portion of the bounce at 10931, a decent level of support. Rising up off the low there is a trend-line developing. It is an unproven trend-line given that it only has the bare requirements, but could become a key line upon a successful hold.
The parallel to the trend-line connects well to the first bounce high and a pair of short-term overnight peaks on the hourly chart. This gives the lower-side line a bit more weight, and should it hold on a test then a nice-looking channel will come into focus to operate with.
The bottom line is there should be opportunities for the short-term trader to take advantage of in both directions given the level of volatility and developing set of technical levels/lines.

GBP/USD Hourly Chart
Resources for Forex Traders
Whether you are a new or experienced trader, we have several resources available to help you; indicator for tracking trader sentiment, quarterly trading forecasts, analytical and educational webinars held daily, trading guides to help you improve trading performance, and one specifically for those who are new to forex.
---Written by Paul Robinson, Market Analyst
You can follow Paul on Twitter at @PaulRobinsonFX


